CBSE Class 10 Sample Paper for 2027 Boards - Maths Standard

 You are here
CBSE Class 10 Sample Paper for 2027 Boards - Maths Standard
Last updated at October 9, 2026 by Teachoo
Transcript
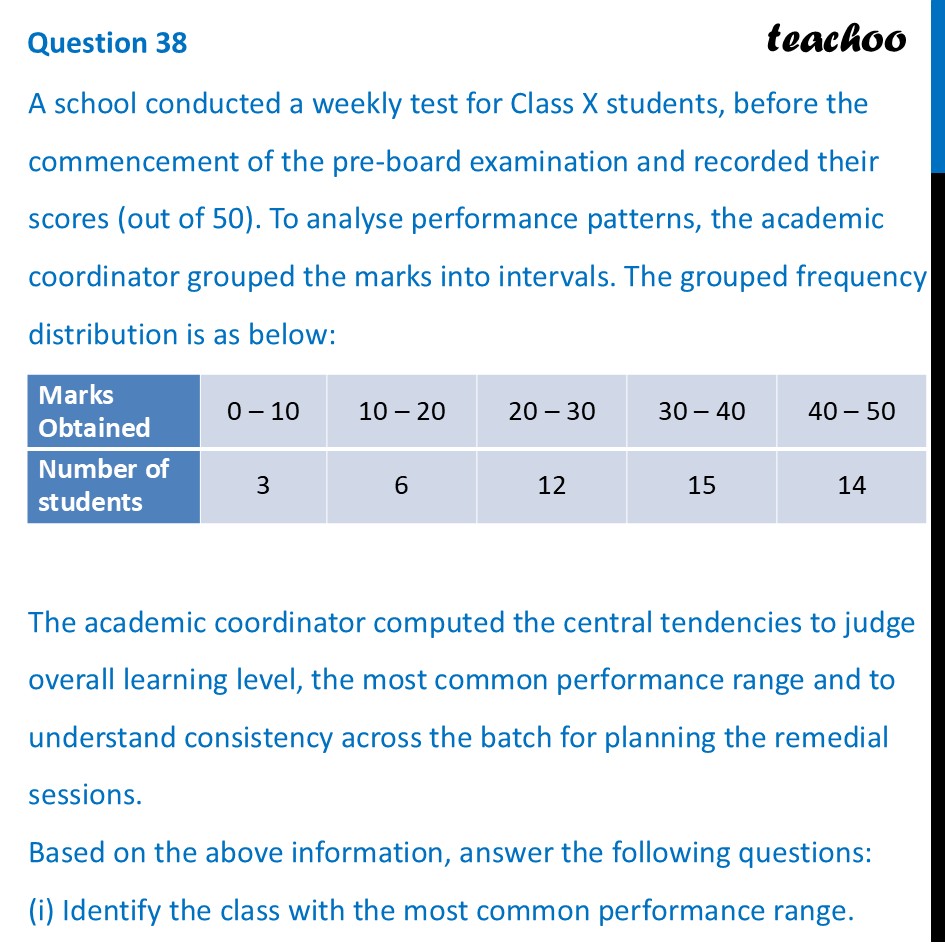
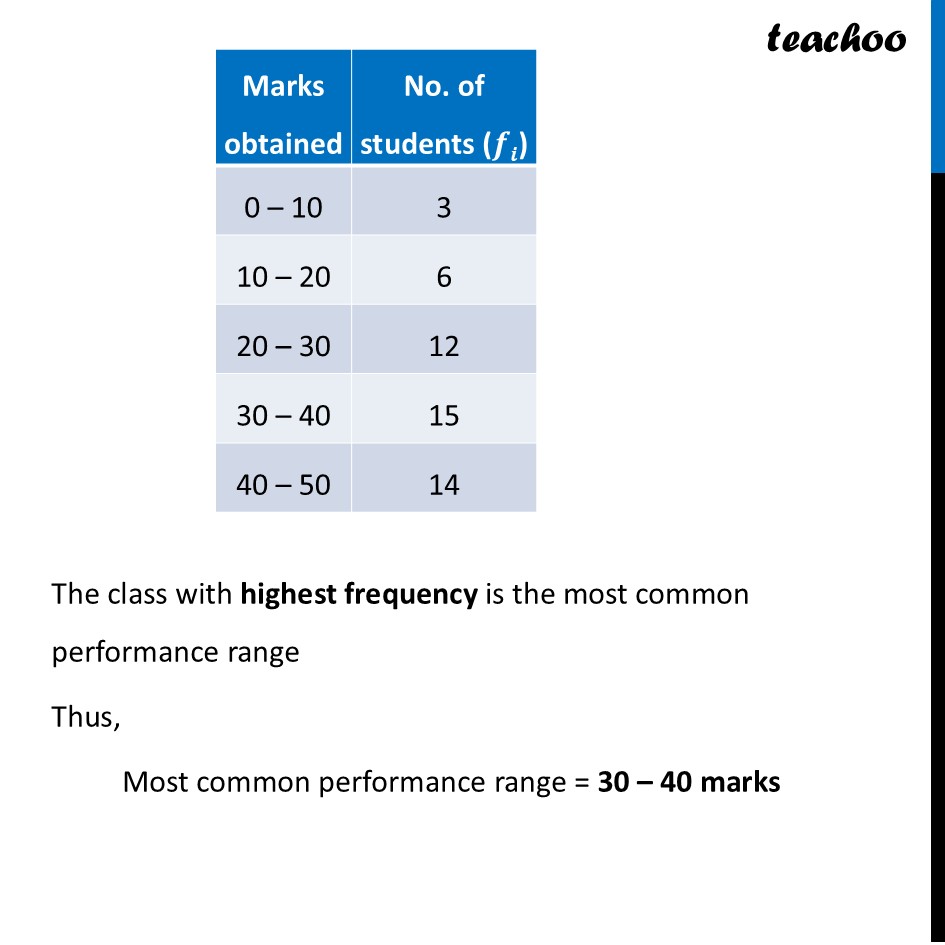
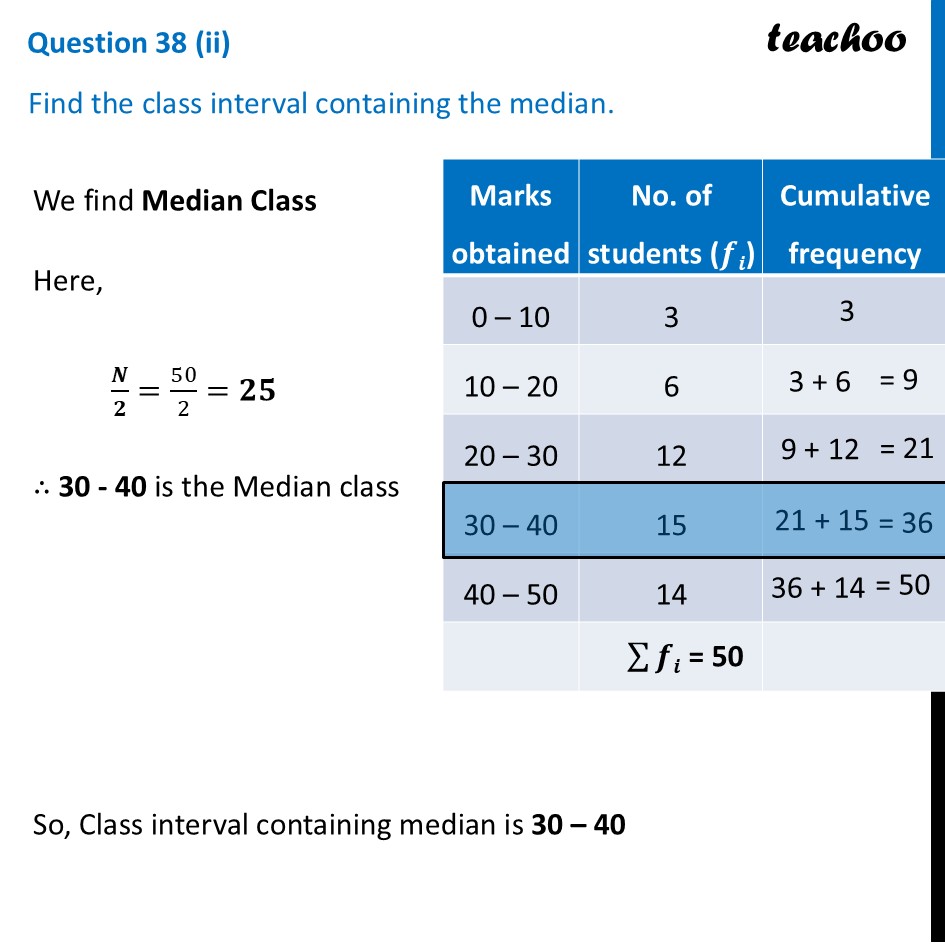
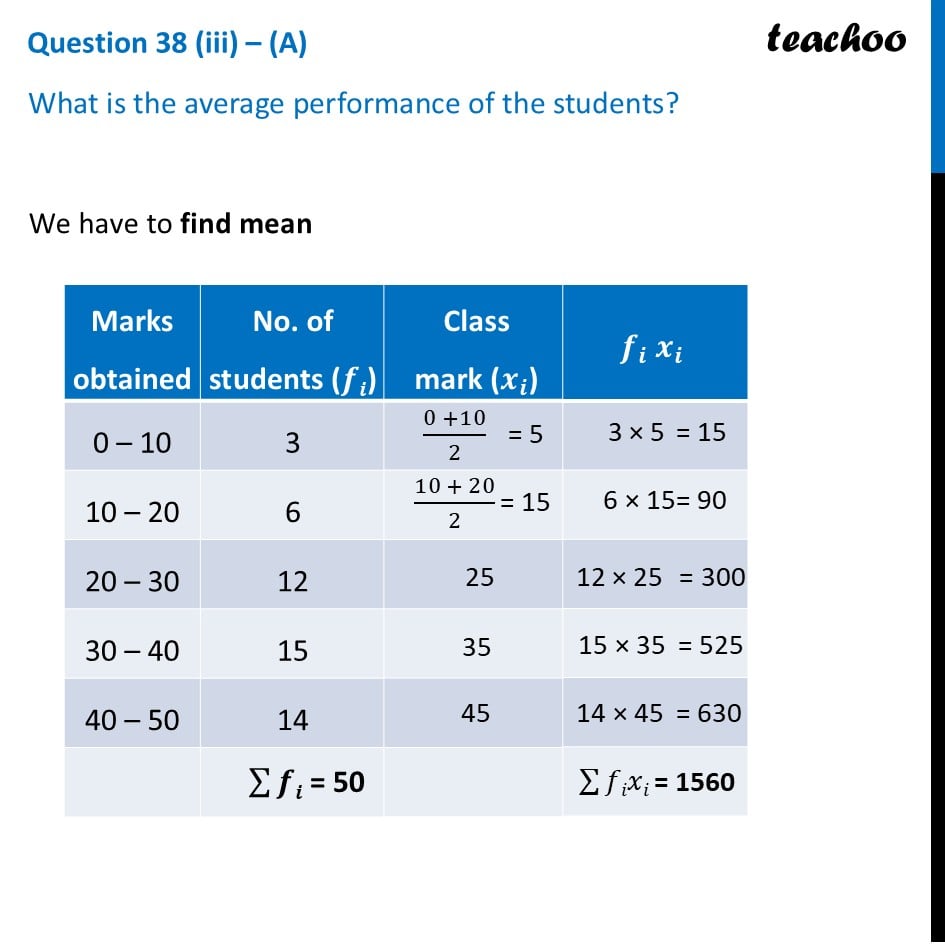
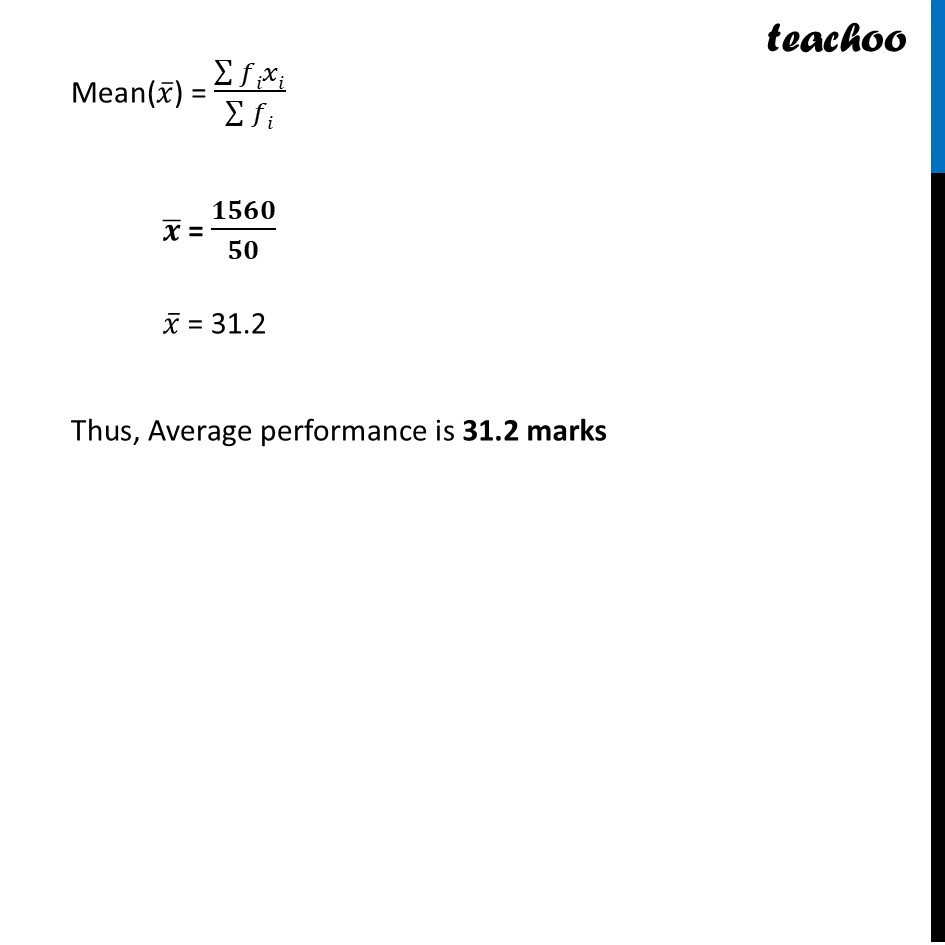
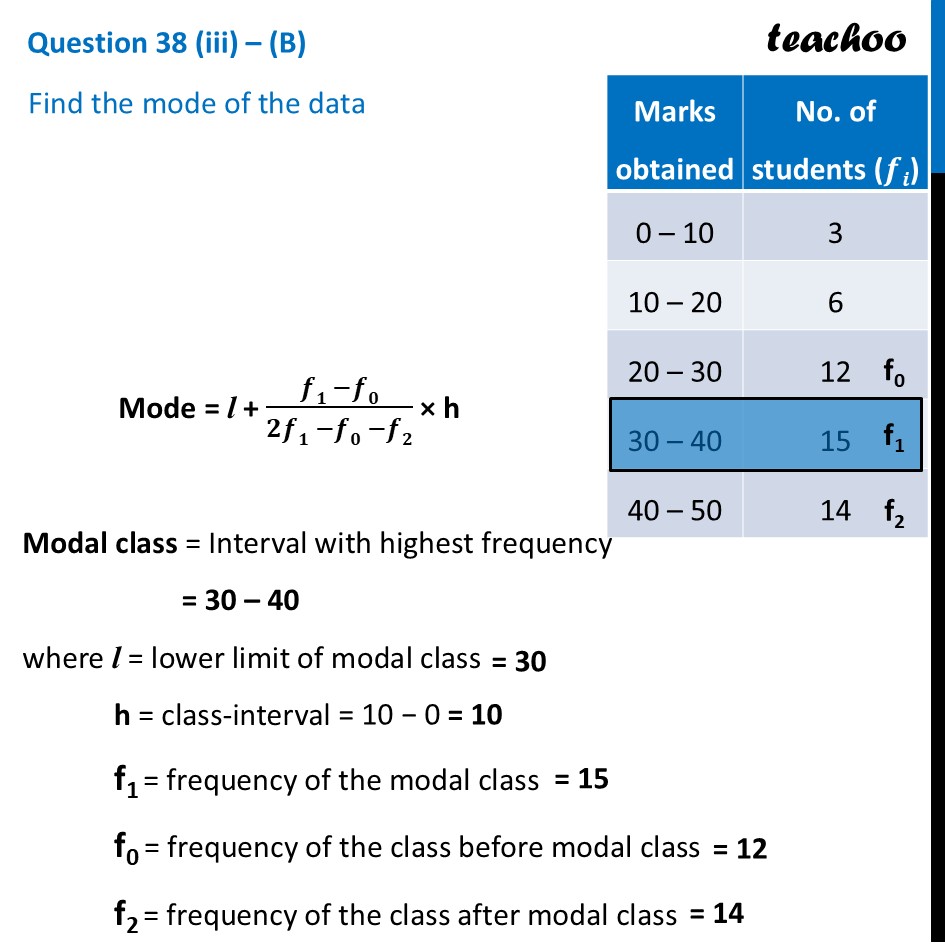
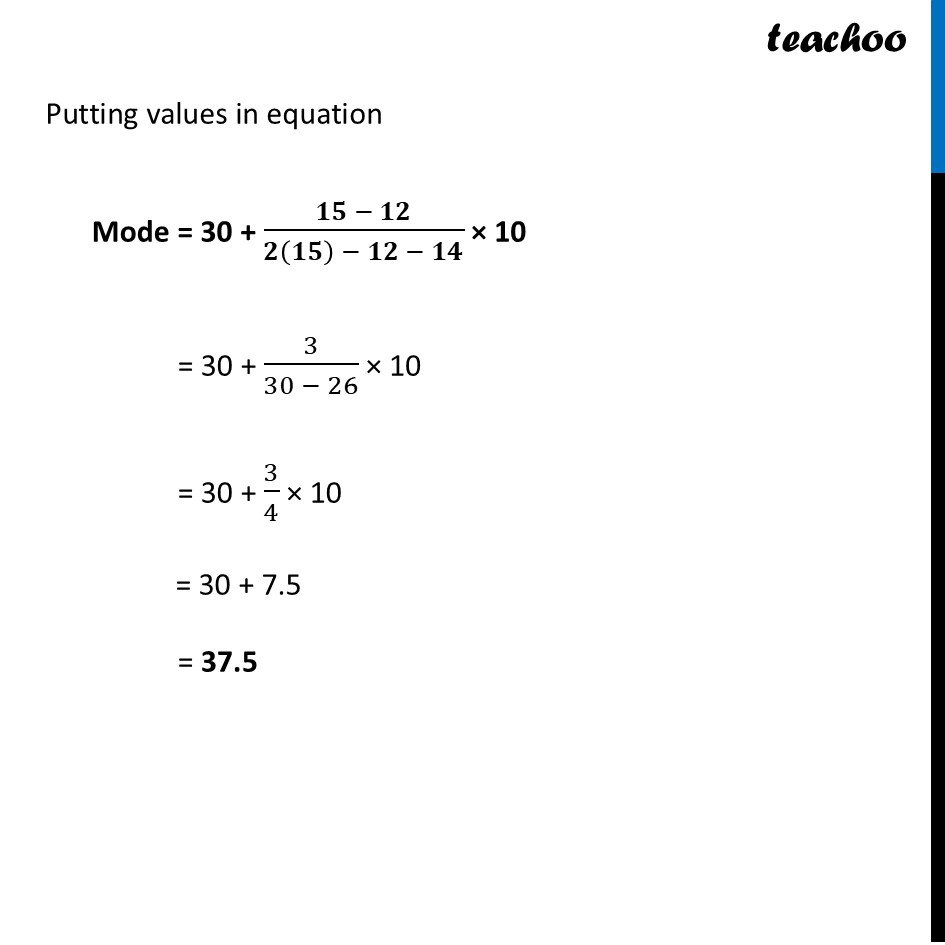
Question 38 A school conducted a weekly test for Class X students, before the commencement of the pre-board examination and recorded their scores (out of 50). To analyse performance patterns, the academic coordinator grouped the marks into intervals. The grouped frequency distribution is as below: The academic coordinator computed the central tendencies to judge overall learning level, the most common performance range and to understand consistency across the batch for planning the remedial sessions. Based on the above information, answer the following questions: (i) Identify the class with the most common performance range. Marks Obtained | 0 – 10 | 10 – 20 | 20 – 30 | 30 – 40 | 40 – 50 Number of students | 3 | 6 | 12 | 15 | 14 The class with highest frequency is the most common performance range Thus, Most common performance range = 30 – 40 marks Marks obtained | No. of students (𝒇𝒊) 0 – 10 | 3 10 – 20 | 6 20 – 30 | 12 30 – 40 | 15 40 – 50 | 14 Marks obtained | 0 – 10 | 3 10 – 20 | 6 20 – 30 | 12 30 – 40 | 15 40 – 50 | 14 Marks obtained | No. of students (𝒇𝒊) 0 – 10 | 3 10 – 20 | 6 20 – 30 | 12 30 – 40 | 15 40 – 50 | 14 | Marks obtained | 0 – 10 | 3 10 – 20 | 6 20 – 30 | 12 30 – 40 | 15 40 – 50 | 14 | Cumulative frequency Question 38 (ii) Find the class interval containing the median. We find Median Class Here, (𝑵)/(𝟐)=(50)/(2)=𝟐𝟓 ∴ 30 - 40 is the Median class So, Class interval containing median is 30 – 40 3 3 + 6 = 9 9 + 12 = 21 21 + 15 = 36 36 + 14 = 50 ∑_()^() 𝒇𝒊 = 50 Question 38 (iii) – (A) What is the average performance of the students? We have to find mean Marks obtained | No. of students (𝒇𝒊) 0 – 10 | 3 10 – 20 | 6 20 – 30 | 12 30 – 40 | 15 40 – 50 | 14 | Marks obtained | 0 – 10 | 3 10 – 20 | 6 20 – 30 | 12 30 – 40 | 15 40 – 50 | 14 | ∑_()^() 𝒇𝒊 = 50 Class mark (𝒙_(𝒊)) 𝒇_(𝒊) 𝒙_(𝒊) 3 × 5 = 15 6 × 15 = 90 12 × 25 = 300 15 × 35 = 525 14 × 45 = 630 ∑_()^() 𝑓𝑖𝑥𝑖 = 1560 (0 +10)/(2) = 5 (10 + 20)/(2) = 15 25 35 45 Mean(̅(𝑥)) = (∑_()^() 𝑓𝑖𝑥𝑖)/(∑_()^() 𝑓𝑖) ̅(𝒙) = (𝟏𝟓𝟔𝟎)/(𝟓𝟎) ̅(𝑥) = 31.2 Thus, Average performance is 31.2 marks Question 38 (iii) – (B) Find the mode of the data Marks obtained | No. of students (𝒇𝒊) 0 – 10 | 3 10 – 20 | 6 20 – 30 | 12 30 – 40 | 15 40 – 50 | 14 Marks obtained | 0 – 10 | 3 10 – 20 | 6 20 – 30 | 12 30 – 40 | 15 40 – 50 | 14 f_(0) f_(1) f_(2) Mode = l + (𝒇𝟏 −𝒇𝟎)/(𝟐𝒇𝟏 −𝒇𝟎 −𝒇𝟐) × h Modal class = Interval with highest frequency = 30 – 40 where l = lower limit of modal class h = class-interval f_(1)_( )= frequency of the modal class f_(0)_( )= frequency of the class before modal class f_(2)_( )= frequency of the class after modal class = 30 = 10 − 0 = 10 = 15 = 12 = 14 Putting values in equation Mode = 30 + (𝟏𝟓 − 𝟏𝟐)/(𝟐(𝟏𝟓) − 𝟏𝟐 − 𝟏𝟒) × 10 = 30 + (3)/(30 − 26) × 10 = 30 + (3)/(4) × 10 = 30 + 7.5 = 37.5