You are here

End-of-Chapter Exercises
Last updated at October 23, 2026 by Teachoo
Transcript
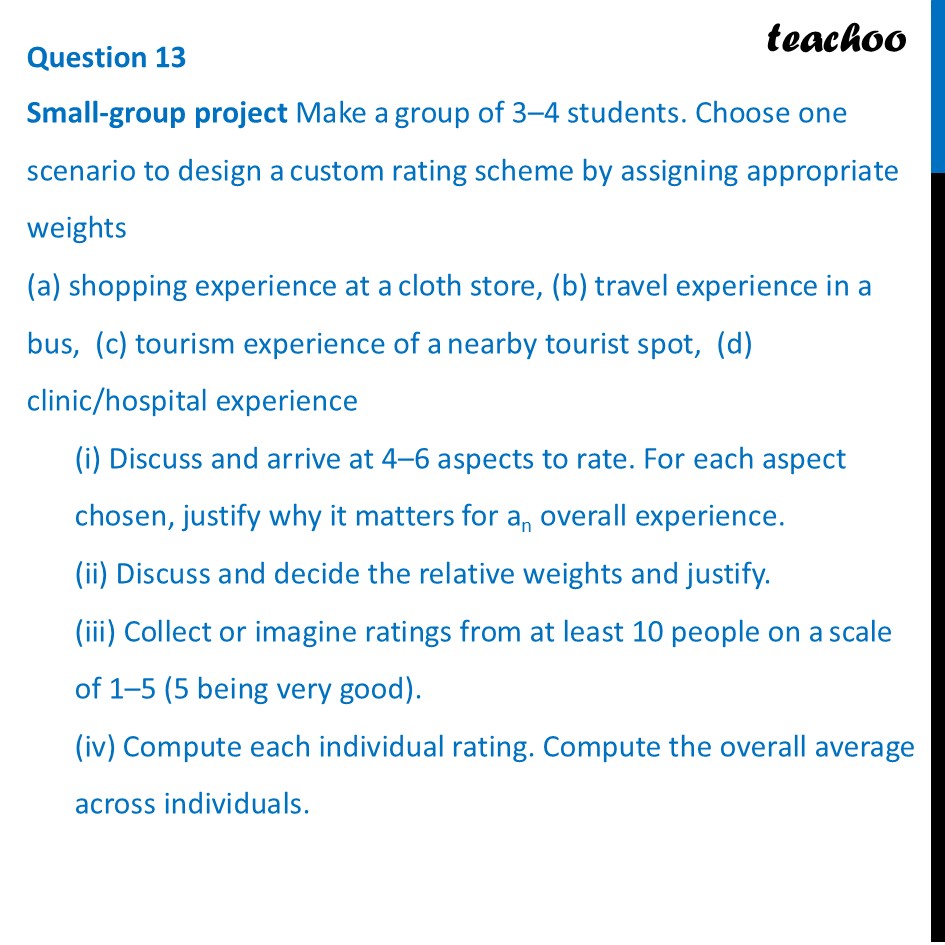
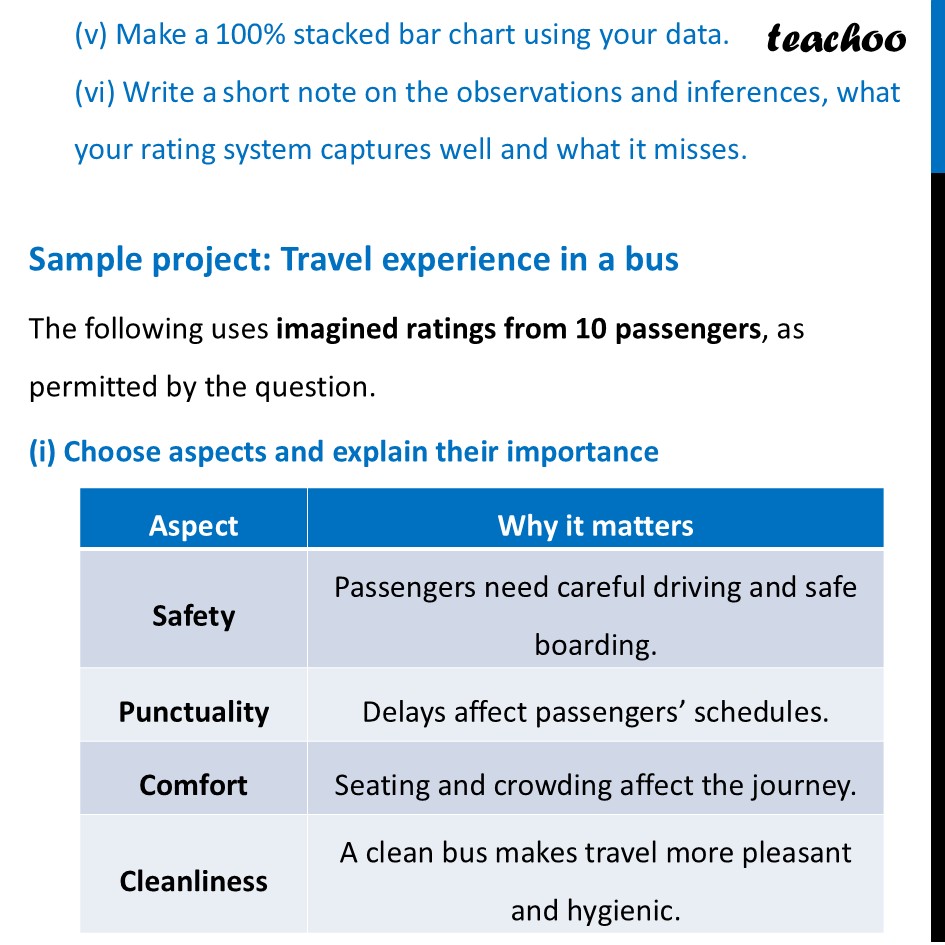
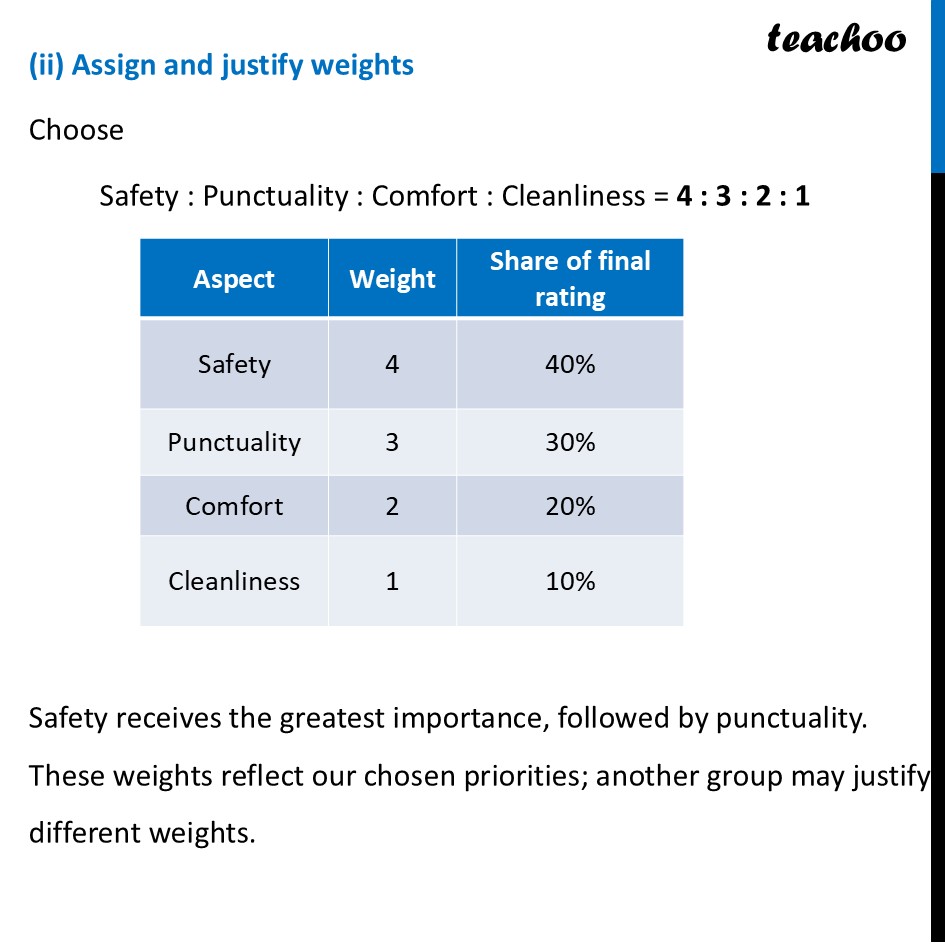
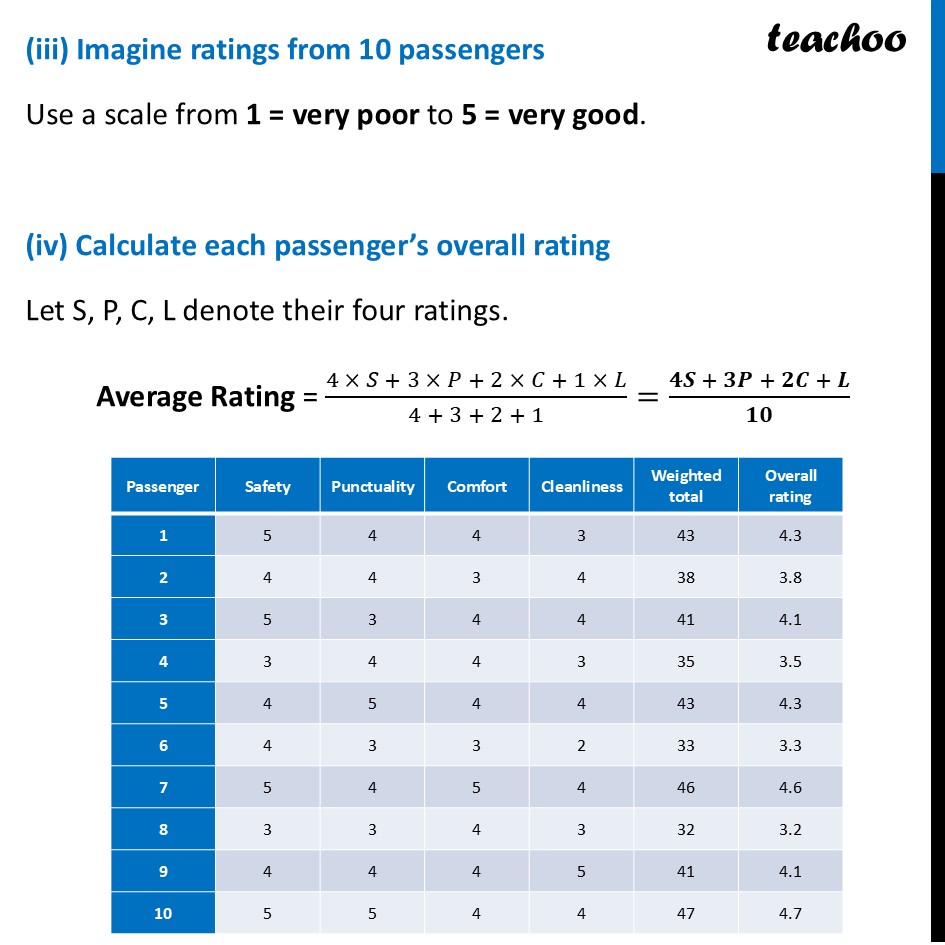
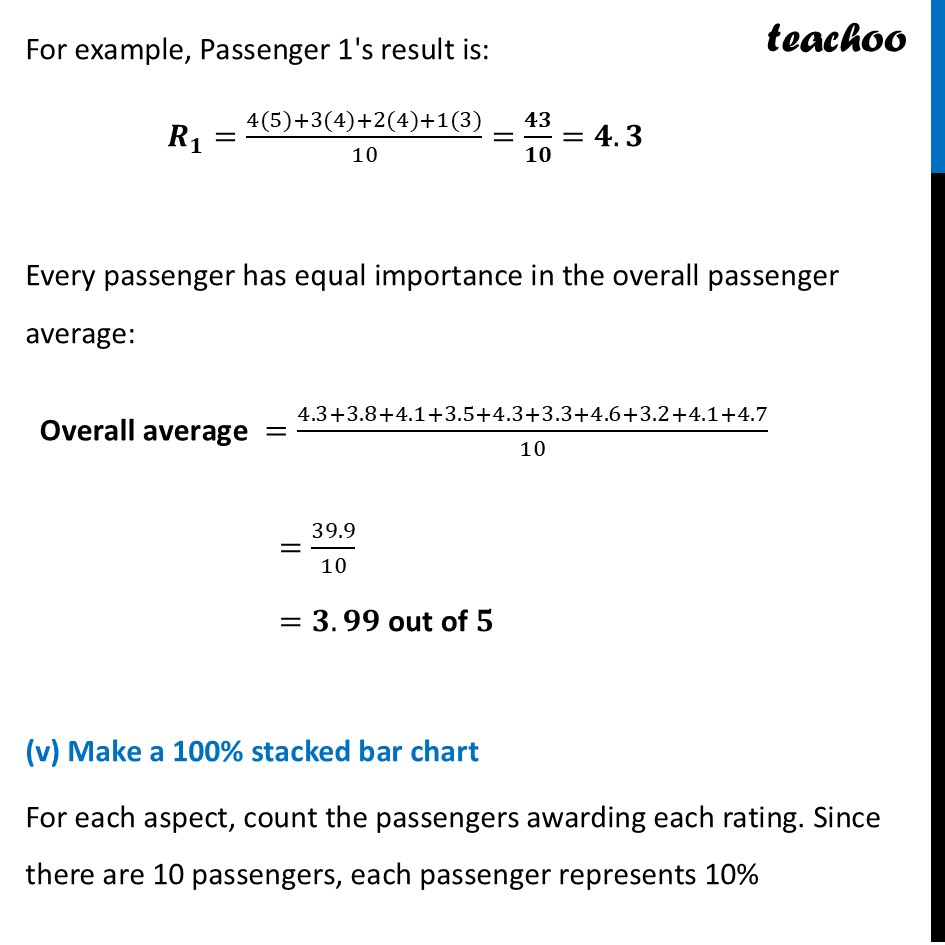
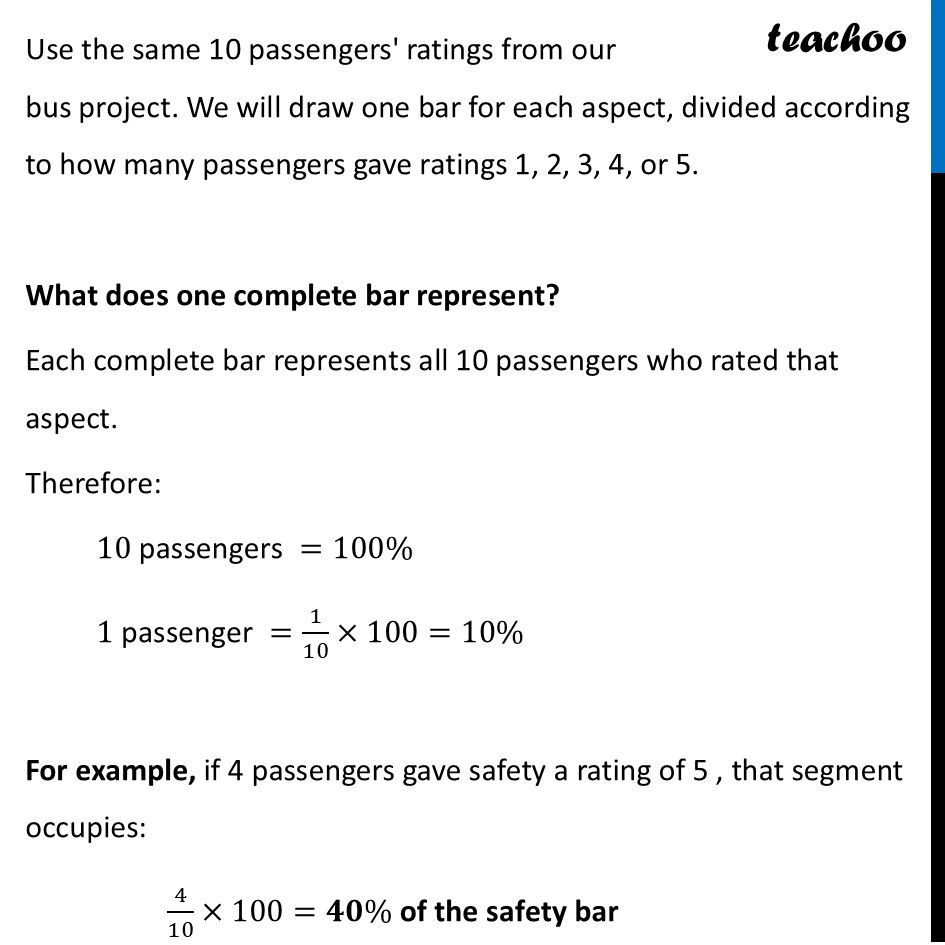
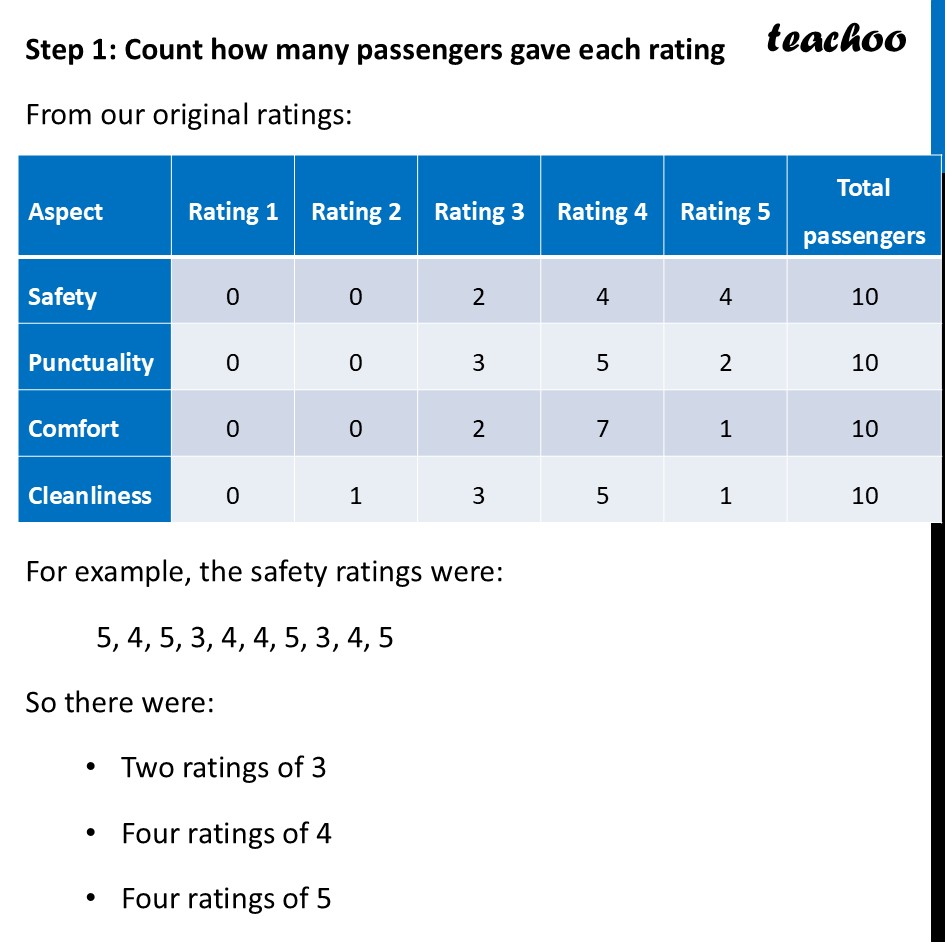
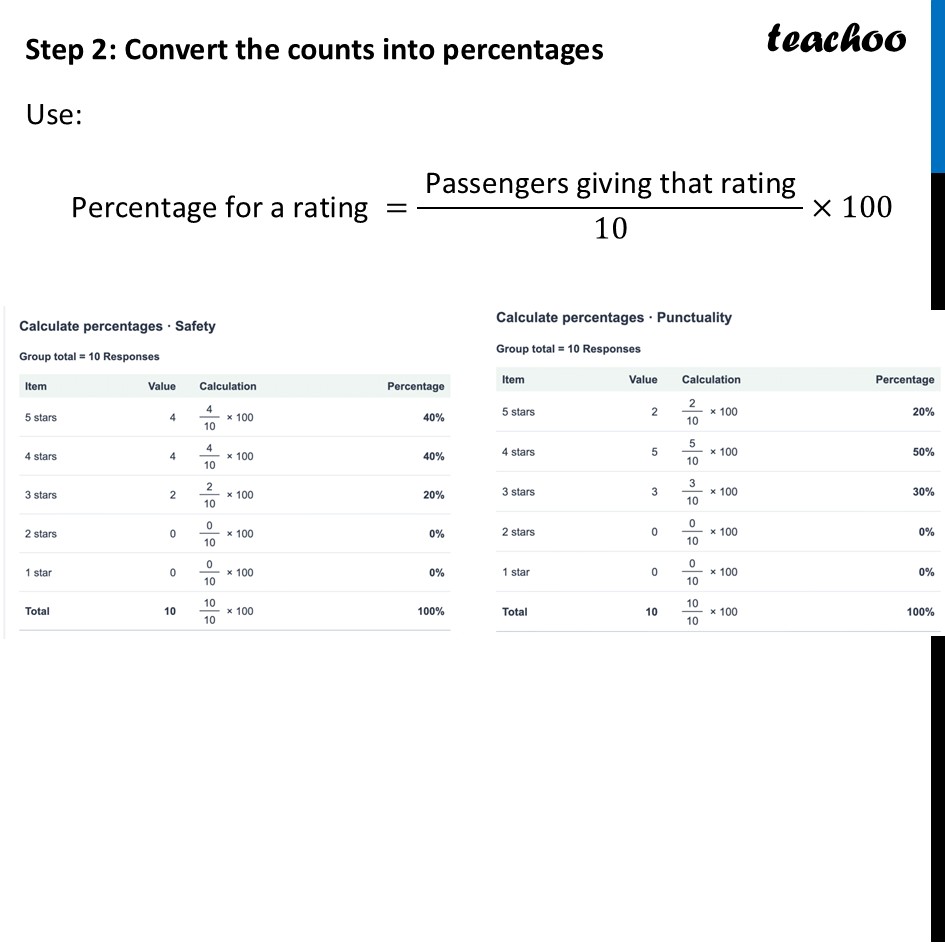
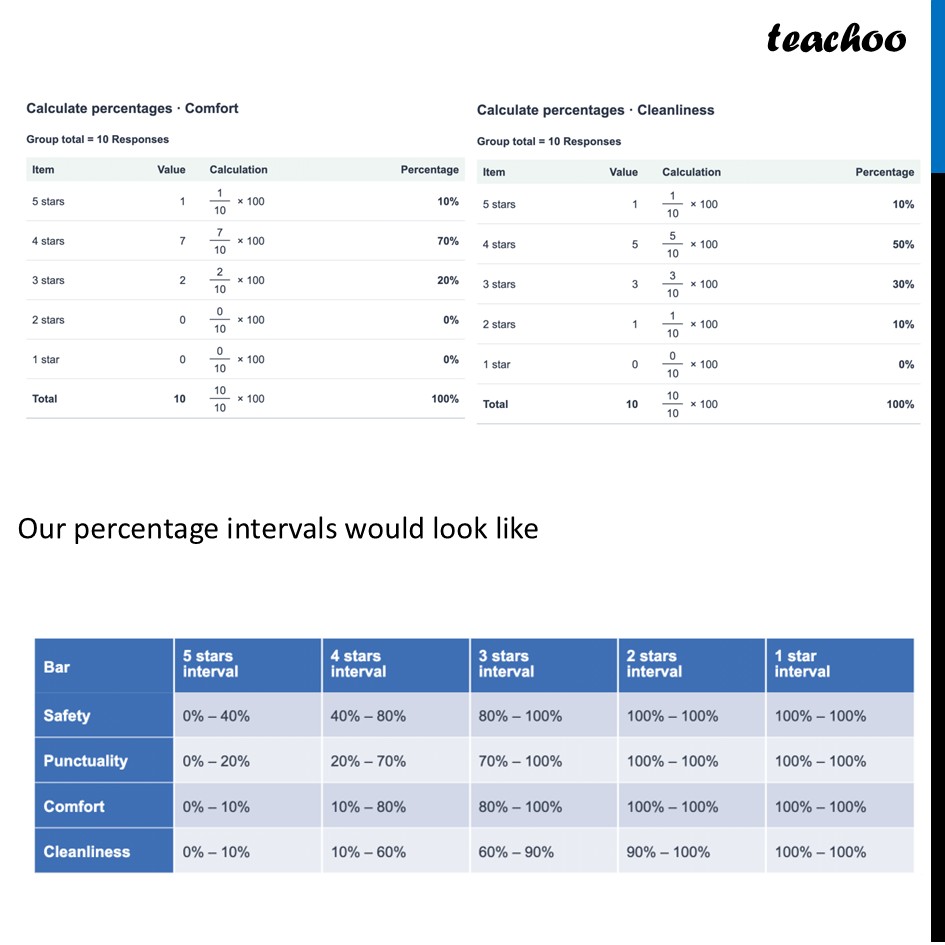
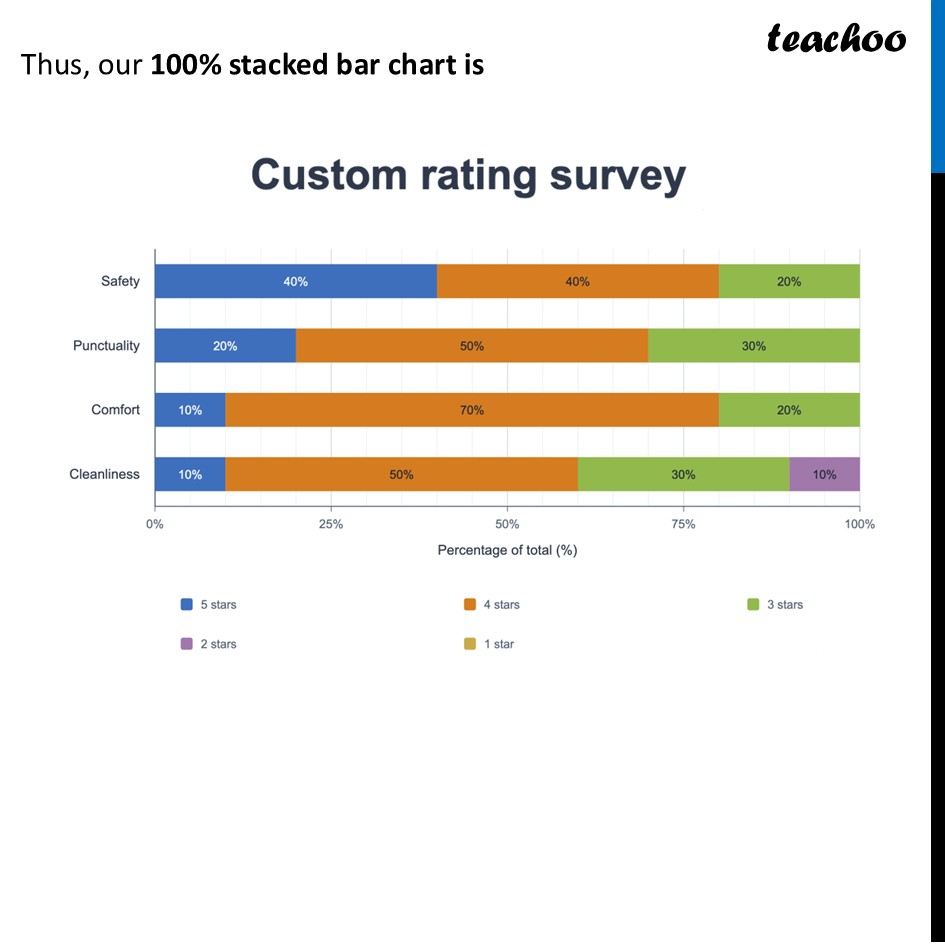
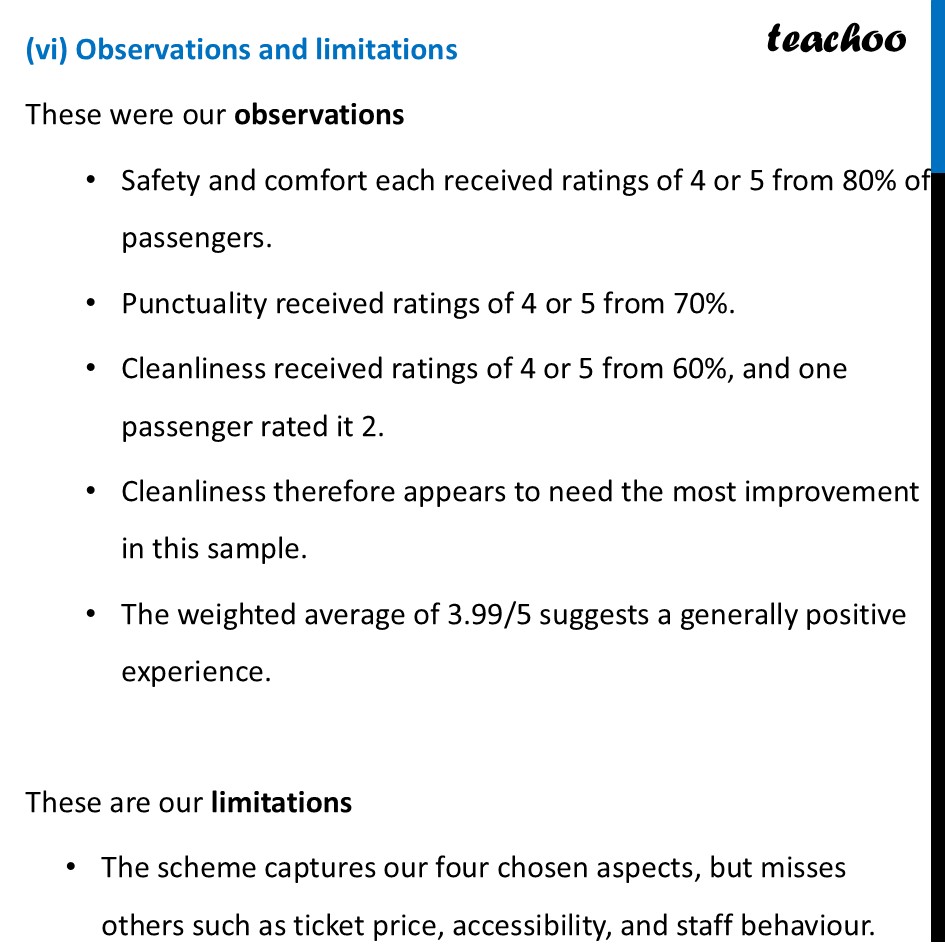
Question 13 Small-group project Make a_( )group of 3–4 students. Choose one scenario to design a_( )custom rating scheme by assigning appropriate weights (a) shopping experience at a_( )cloth store, (b) travel experience in a_( )bus, (c) tourism experience of a_( )nearby tourist spot, (d) clinic/hospital experience (i) Discuss and arrive at 4–6 aspects to rate. For each aspect chosen, justify why it matters for a_(n) overall experience. (ii) Discuss and decide the relative weights and justify. (iii) Collect or imagine ratings from at least 10 people on a_( )scale of 1–5 (5 being very good). (iv) Compute each individual rating. Compute the overall average across individuals. (v) Make a_( )100% stacked bar chart using your data. (vi) Write a_( )short note on the observations and inferences, what your rating system captures well and what it misses. Sample project: Travel experience in a bus The following uses imagined ratings from 10 passengers, as permitted by the question. (i) Choose aspects and explain their importance Aspect | Why it matters Safety | Passengers need careful driving and safe boarding. Punctuality | Delays affect passengers’ schedules. Comfort | Seating and crowding affect the journey. Cleanliness | A clean bus makes travel more pleasant and hygienic. (ii) Assign and justify weights Choose Safety : Punctuality : Comfort : Cleanliness = 4 : 3 : 2 : 1 Safety receives the greatest importance, followed by punctuality. These weights reflect our chosen priorities; another group may justify different weights. Aspect | Weight | Share of final rating Safety | 4 | 40% Punctuality | 3 | 30% Comfort | 2 | 20% Cleanliness | 1 | 10% (iii) Imagine ratings from 10 passengers Use a scale from 1 = very poor to 5 = very good. (iv) Calculate each passenger’s overall rating Let S, P, C, L denote their four ratings. Average Rating = (4 × 𝑆 + 3 × 𝑃 + 2 × 𝐶 + 1 × 𝐿)/(4 + 3 + 2 + 1)=(𝟒𝑺 + 𝟑𝑷 + 𝟐𝑪 + 𝑳)/(𝟏𝟎) Passenger | Safety | Punctuality | Comfort | Cleanliness | Weighted total | Overall rating 1 | 5 | 4 | 4 | 3 | 43 | 4.3 2 | 4 | 4 | 3 | 4 | 38 | 3.8 3 | 5 | 3 | 4 | 4 | 41 | 4.1 4 | 3 | 4 | 4 | 3 | 35 | 3.5 5 | 4 | 5 | 4 | 4 | 43 | 4.3 6 | 4 | 3 | 3 | 2 | 33 | 3.3 7 | 5 | 4 | 5 | 4 | 46 | 4.6 8 | 3 | 3 | 4 | 3 | 32 | 3.2 9 | 4 | 4 | 4 | 5 | 41 | 4.1 10 | 5 | 5 | 4 | 4 | 47 | 4.7 For example, Passenger 1's result is: 𝑹_(𝟏)=(4(5)+3(4)+2(4)+1(3))/(10)=(𝟒𝟑)/(𝟏𝟎)=𝟒.𝟑 Every passenger has equal importance in the overall passenger average: [ Overall average =(4.3+3.8+4.1+3.5+4.3+3.3+4.6+3.2+4.1+4.7)/(10); ] =(39.9)/(10) =𝟑.𝟗𝟗 out of 𝟓 (v) Make a 100% stacked bar chart For each aspect, count the passengers awarding each rating. Since there are 10 passengers, each passenger represents 10% Use the same 10 passengers' ratings from our bus project. We will draw one bar for each aspect, divided according to how many passengers gave ratings 1, 2, 3, 4, or 5. What does one complete bar represent? Each complete bar represents all 10 passengers who rated that aspect. Therefore: 10 passengers =100% 1 passenger =(1)/(10)×100=10% [; ] For example, if 4 passengers gave safety a rating of 5 , that segment occupies: (4)/(10)×100=𝟒𝟎% of the safety bar Step 1: Count how many passengers gave each rating From our original ratings: Step 1: Count how many passengers gave each rating From our original ratings: For example, the safety ratings were: 5, 4, 5, 3, 4, 4, 5, 3, 4, 5 So there were: Two ratings of 3 Four ratings of 4 Four ratings of 5 Aspect | Rating 1 | Rating 2 | Rating 3 | Rating 4 | Rating 5 | Total passengers Safety | 0 | 0 | 2 | 4 | 4 | 10 Punctuality | 0 | 0 | 3 | 5 | 2 | 10 Comfort | 0 | 0 | 2 | 7 | 1 | 10 Cleanliness | 0 | 1 | 3 | 5 | 1 | 10 Step 2: Convert the counts into percentages Use: Percentage for a rating =( Passengers giving that rating )/(10)×100 Calculate percentages - Safety Group total = 10 Responses Item Value 5 stars 4 4 stars 4 3 stars 2 2 stars 0 1 star 0 Total 10 Calculation 4 x 100 Percentage 40% 20% 0% 100% Calculate percentages - Punctuality 5 stars 2 4 stars 2) 3 stars 3 2 — x 100 10 5 3 0 50% 30% Our percentage intervals would look like Calculate percentages - Comfort Group total = 10 Responses Item Value 5 stars 1 4 stars 7 3 stars 2 2 stars 0 1 star 0 Total 10 Calculation oe 10 - 1 x 100 Percentage 10% 70% 20% 0% 100% Calculate percentages - Cleanliness 4 stars 5 3 stars 3 2 stars 1 as 50% 30% 5 stars 4 stars 3 stars 2 stars 1 star interval interval interval interval interval 0% — 40% 40% — 80% 80% — 100% 100% — 100% 100% — 100% 0% — 20% 20% — 70% 70% — 100% 100% — 100% 100% — 100% 0% — 10% 10% — 80% 80% — 100% 100% — 100% 100% — 100% 0% — 10% 10% — 60% 60% — 90% 90% — 100% 100% — 100% Thus, our 100% stacked bar chart is 0% 25% 50% 75% 100% Percentage of total (%) @ 5stars @ 4 stars @ 3 stars @ 2stars @ 1star Custom rating survey (vi) Observations and limitations These were our observations Safety and comfort each received ratings of 4 or 5 from 80% of passengers. Punctuality received ratings of 4 or 5 from 70%. Cleanliness received ratings of 4 or 5 from 60%, and one passenger rated it 2. Cleanliness therefore appears to need the most improvement in this sample. The weighted average of 3.99/5 suggests a generally positive experience. These are our limitations The scheme captures our four chosen aspects, but misses others such as ticket price, accessibility, and staff behaviour. The weights reflect our priorities, and ten imagined responses cannot establish how all passengers feel. The weights reflect our priorities, and ten imagined responses cannot establish how all passengers feel.