You are here
End-of-Chapter Exercises
Last updated at October 23, 2026 by Teachoo
Transcript
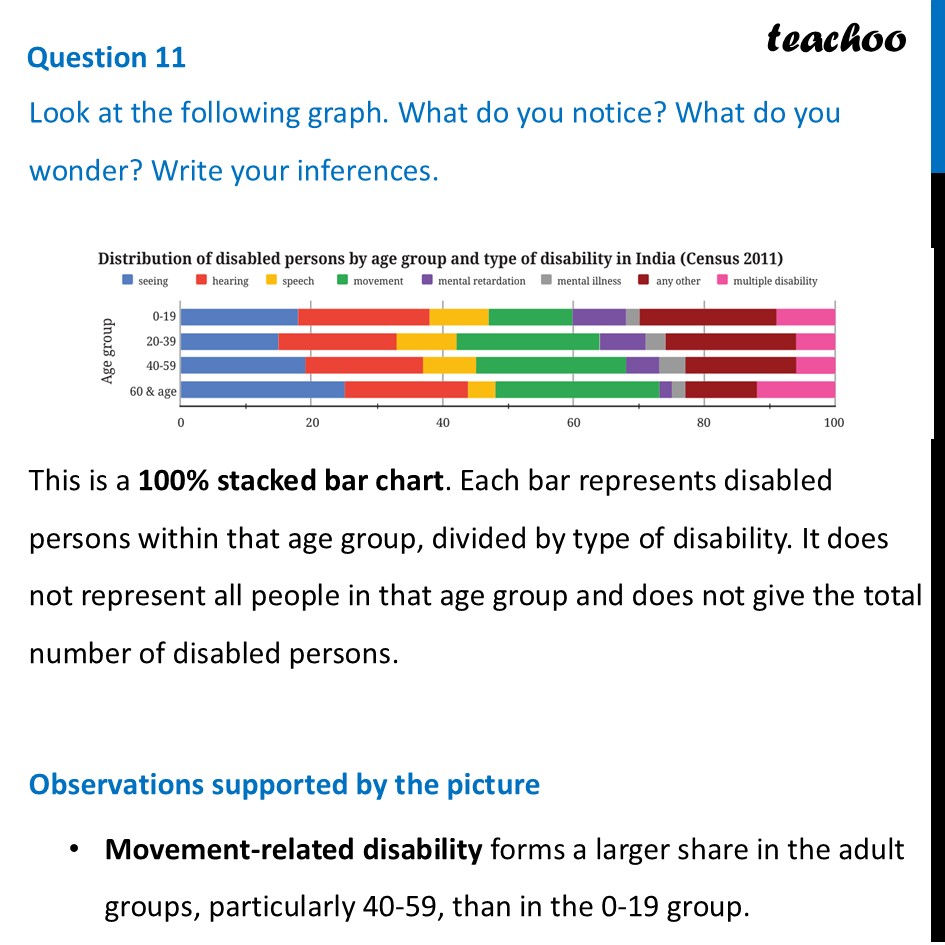
Question 11 Look at the following graph. What do you notice? What do you wonder? Write your inferences. This is a 100% stacked bar chart. Each bar represents disabled persons within that age group, divided by type of disability. It does not represent all people in that age group and does not give the total number of disabled persons. Observations supported by the picture Movement-related disability forms a larger share in the adult groups, particularly 40-59, than in the 0-19 group. Distribution of disabled persons by age group and type of disability in India (Census 2011) @ speech movement W& mental retardation © mental illness @ seeing WD hearing @ anyother WW muttiple disability Age group The seeing and hearing segments are relatively large in the 60+ group; each appears to be about one quarter of that group's distribution. The speech segment appears smaller in older groups than in the 0-19 group. Every age group includes several types of disability; none of the bars is made up of only one type. What cannot be inferred? We cannot say which age group contains the largest number of disabled persons, or that a larger percentage means a larger count across age groups. The totals are not supplied. Nor can this chart establish causes of the differences. Questions worth investigating We can ask How many people are represented in each age group? How do patterns differ by region or gender? How have distributions changed since 2011? These require additional data.