You are here

Last updated at October 23, 2026 by Teachoo
Transcript
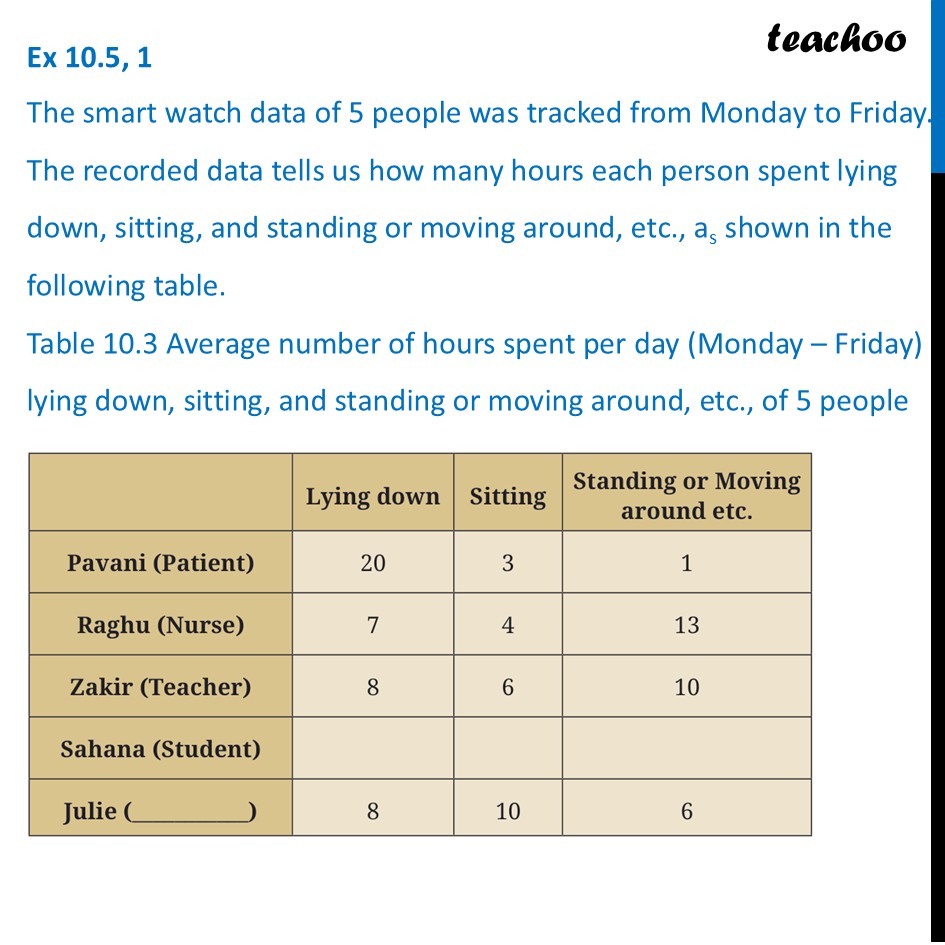
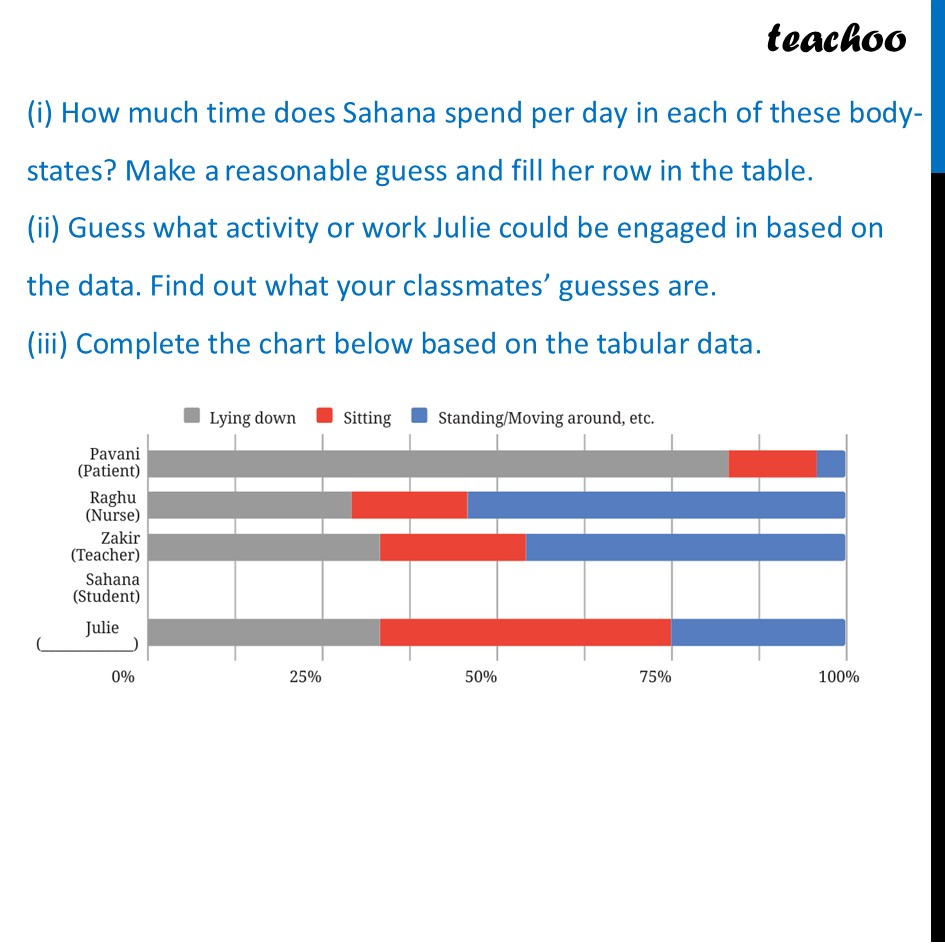
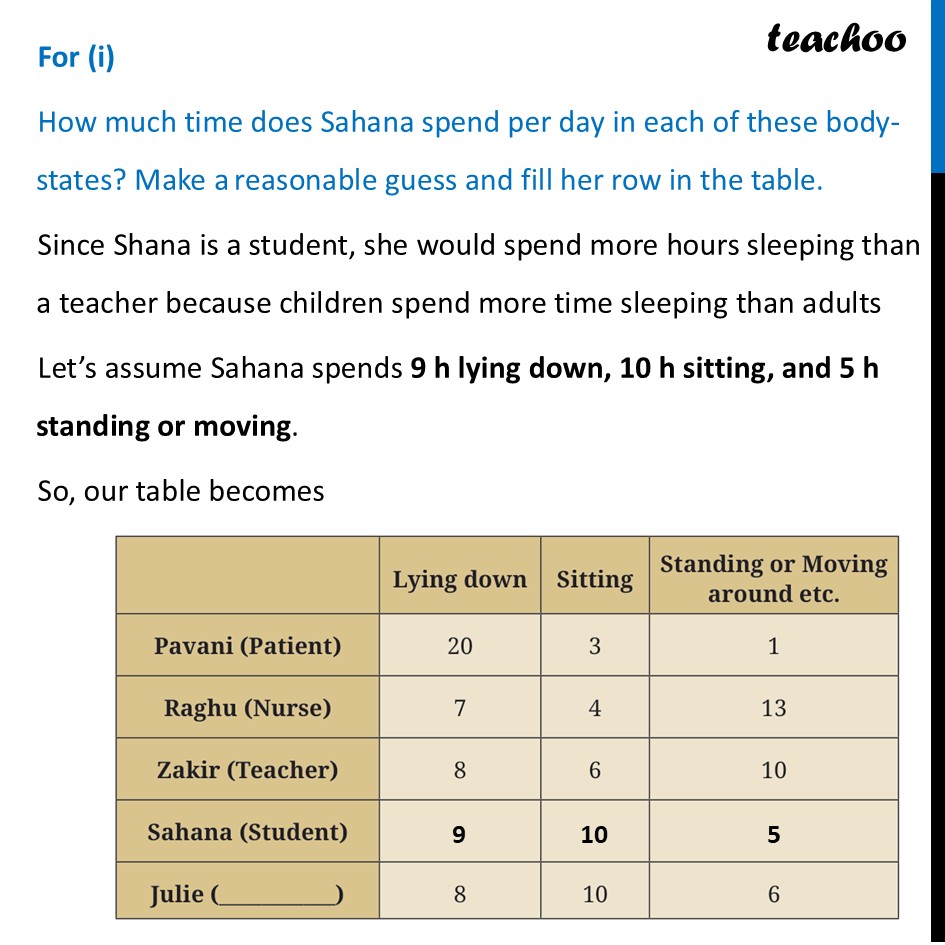
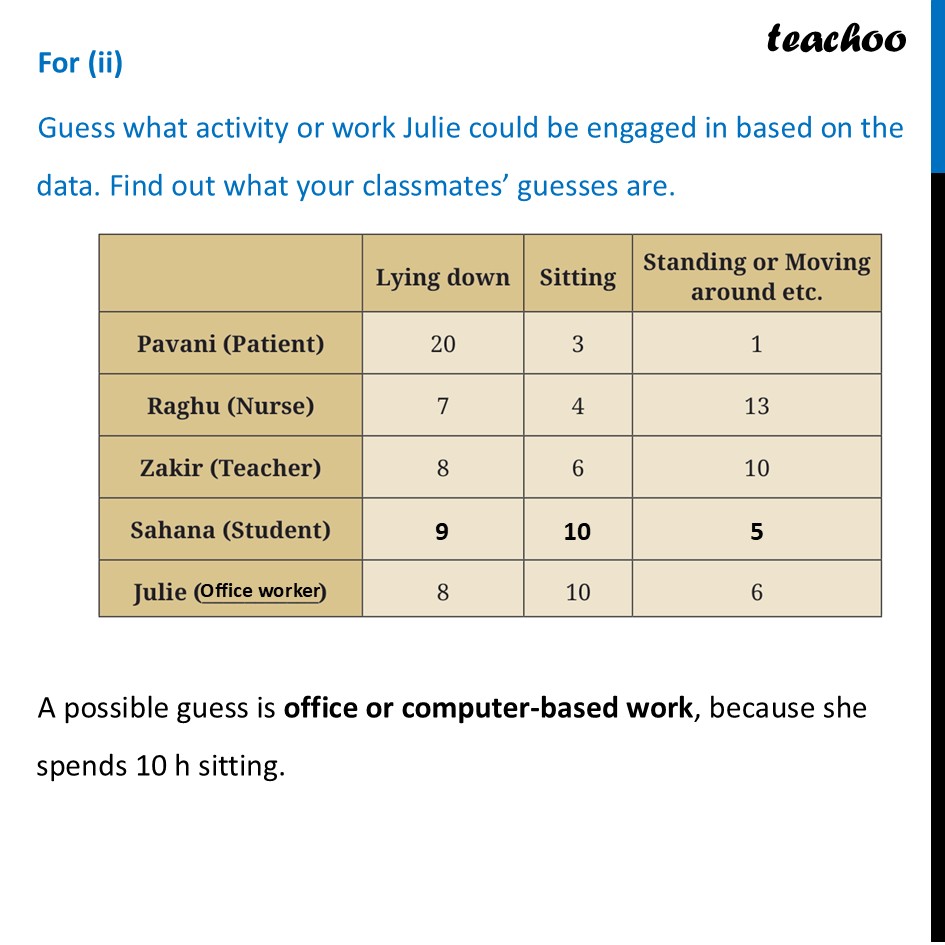
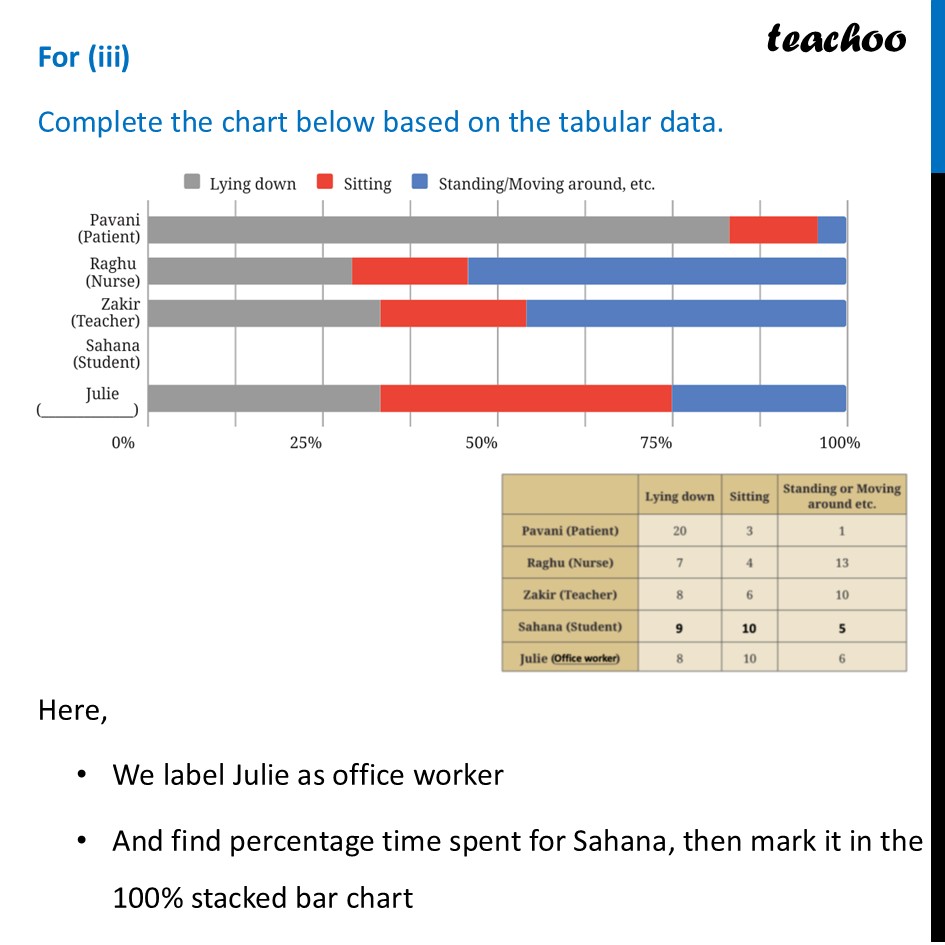
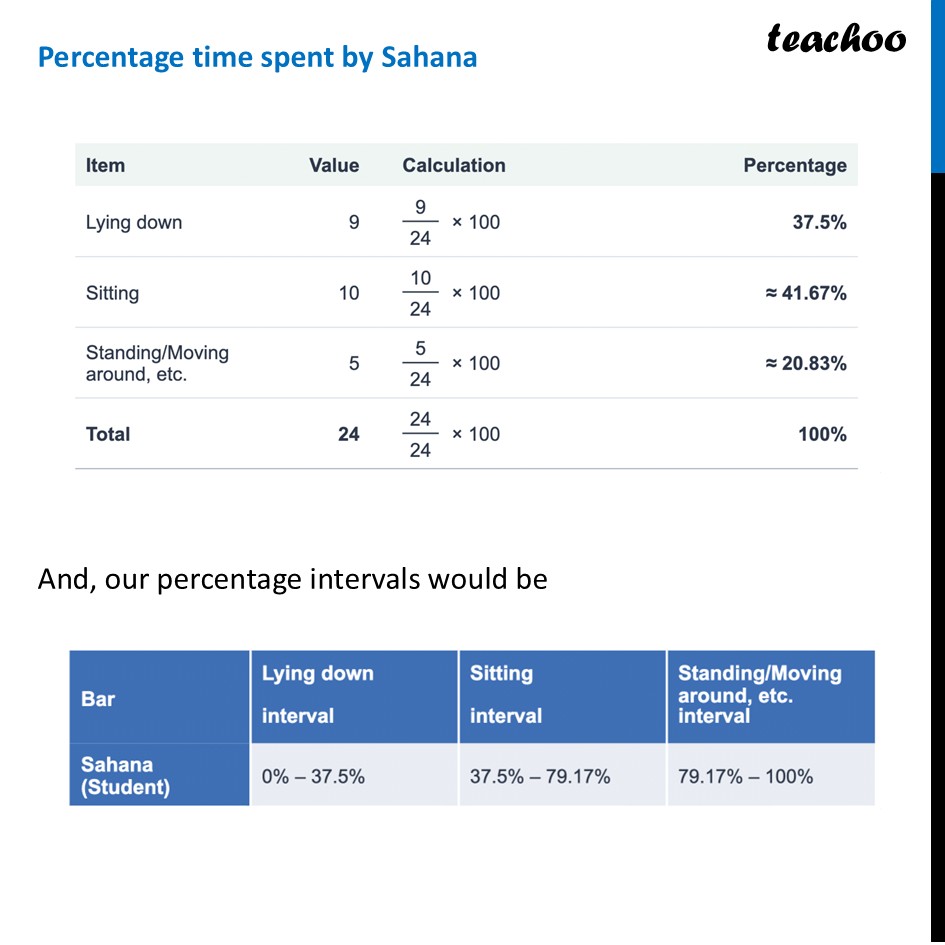
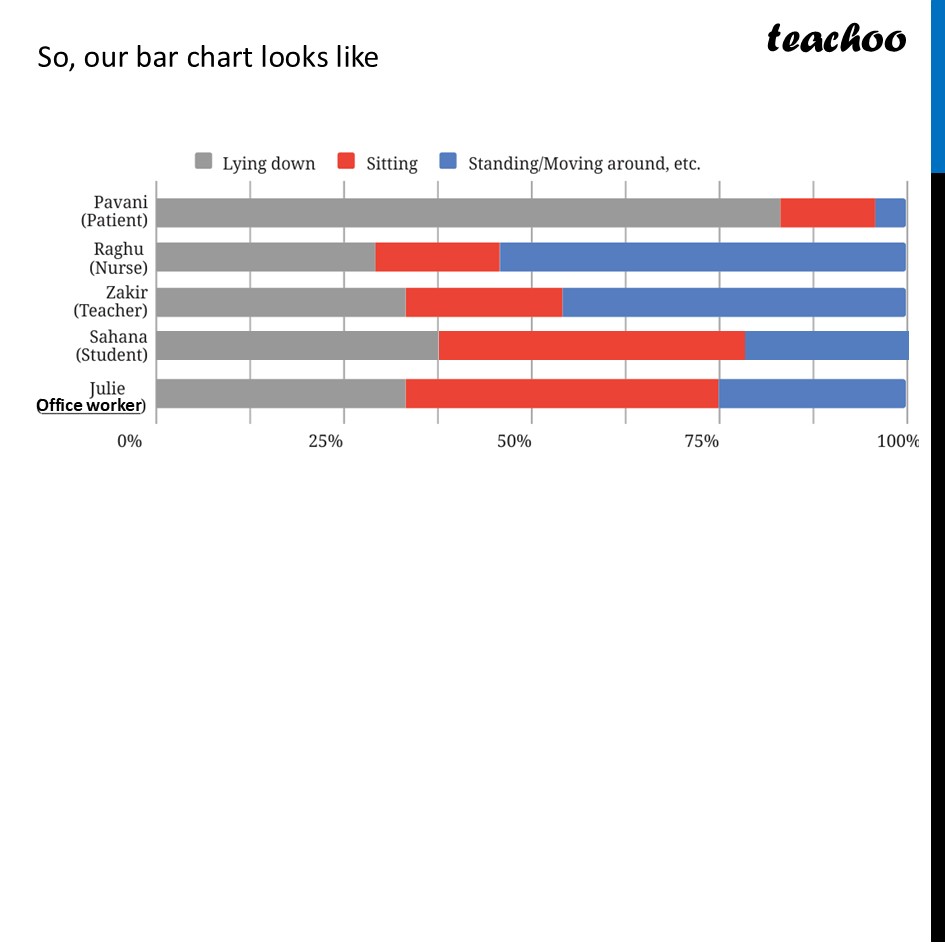
Ex 10.5, 1 The smart watch data of 5 people was tracked from Monday to Friday. The recorded data tells us how many hours each person spent lying down, sitting, and standing or moving around, etc., a_(s) shown in the following table. Table 10.3 Average number of hours spent per day (Monday – Friday) lying down, sitting, and standing or moving around, etc., of 5 people Standing or Moving Lying down | Sitting aranndl ae. Pavani (Patient) 20 3 1 Raghu (Nurse) 7 4 13 Zakir (Teacher) 8 6 10 Sahana (Student) Julie ( ) 8 10 6 (i) How much time does Sahana spend per day in each of these body-states? Make a_( )reasonable guess and fill her row in the table. (ii) Guess what activity or work Julie could be engaged in based on the data. Find out what your classmates’ guesses are. (iii) Complete the chart below based on the tabular data. @ Lyingdown G sitting © standing/Moving around, etc. Pavani (Patient) Raghu (Nurse) Zakir (Teacher) Sahana (Student) Julie 0% 25% 50% 75% 100% For (i) How much time does Sahana spend per day in each of these body-states? Make a_( )reasonable guess and fill her row in the table. Since Shana is a student, she would spend more hours sleeping than a teacher because children spend more time sleeping than adults Let’s assume Sahana spends 9 h lying down, 10 h sitting, and 5 h standing or moving. So, our table becomes 9 10 5 Standing or Moving Lying down | Sitting aranndl ae. Pavani (Patient) 20 3 1 Raghu (Nurse) 7 4 13 Zakir (Teacher) 8 6 10 Sahana (Student) Julie ( ) 8 10 6 For (ii) Guess what activity or work Julie could be engaged in based on the data. Find out what your classmates’ guesses are. A possible guess is office or computer-based work, because she spends 10 h sitting. 9 10 5 Office worker Standing or Moving Lying down | Sitting aranndl ae. Pavani (Patient) 20 3 1 Raghu (Nurse) 7 4 13 Zakir (Teacher) 8 6 10 Sahana (Student) Julie ( ) 8 10 6 For (iii) Complete the chart below based on the tabular data. Here, We label Julie as office worker And find percentage time spent for Sahana, then mark it in the 100% stacked bar chart For (iii) teackoo @ Lyingdown @ sitting W@ standing/Moving around, etc. Pavani (Patient) Raghu (Nurse) Zakir (Teacher) Sahana (Student) Julie 0% 25% 50% 75% 100% * We label Julie as office worker * And find percentage time spent for Sahana, then mark it in the 100% stacked bar chart Percentage time spent by Sahana And, our percentage intervals would be Item Lying down Sitting Standing/Moving around, etc. Total Value 10 24 Calculation fe) — * 100 — x 100 9) —.. *~ 100 -— * 100 Percentage 37.5% = 41.67% = 20.83% 100% Lying down Sitting Standing/Moving Bar around, etc. interval interval interval Sahana (Student) 0% — 37.5% 37.5% — 79.17% 79.17% — 100% So, our bar chart looks like Office worker @ Lyingdown G sitting © standing/Moving around, etc. Pavani (Patient) Raghu (Nurse) Zakir (Teacher) Sahana (Student) Julie 0% 25% 50% 75% 100%