You are here

Stacked Bar or Column Chart
Last updated at October 23, 2026 by Teachoo
Transcript
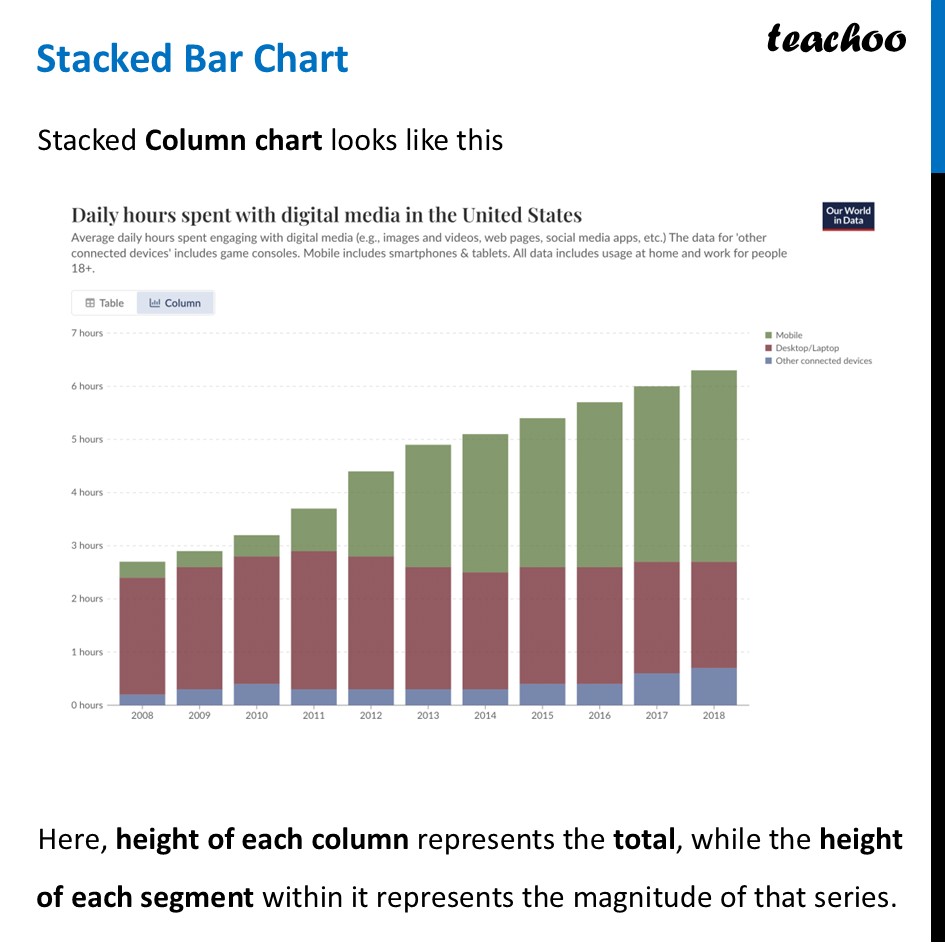
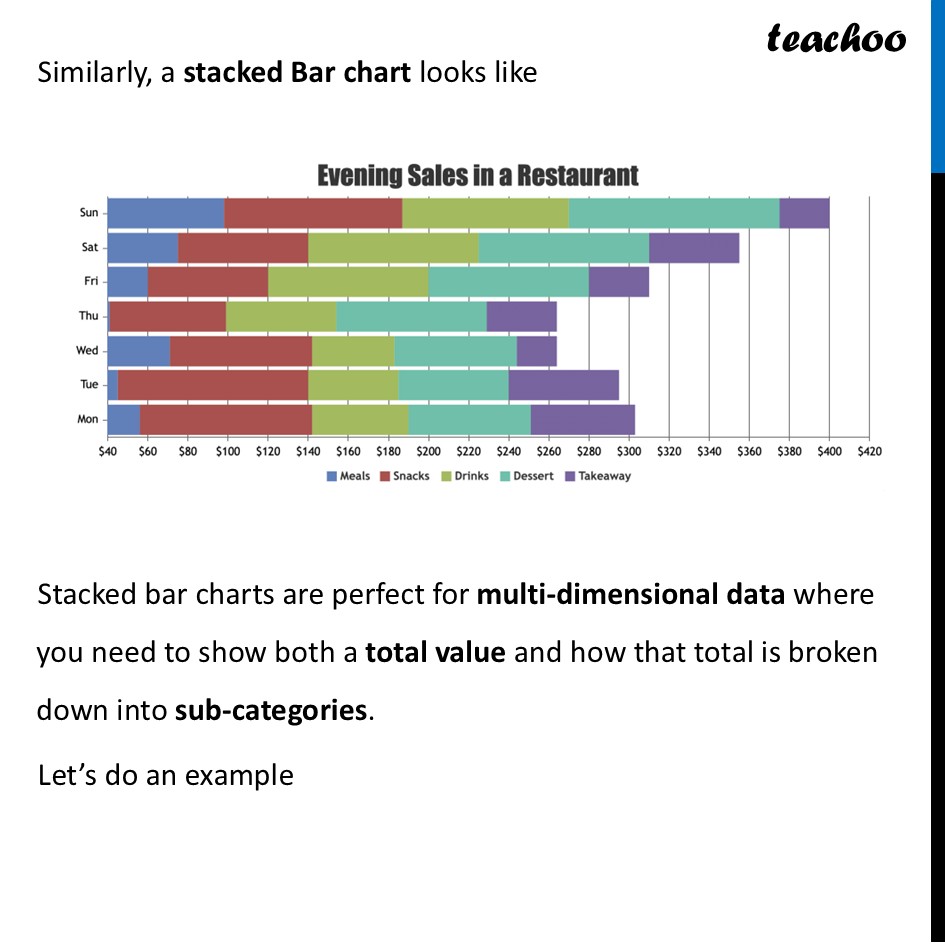
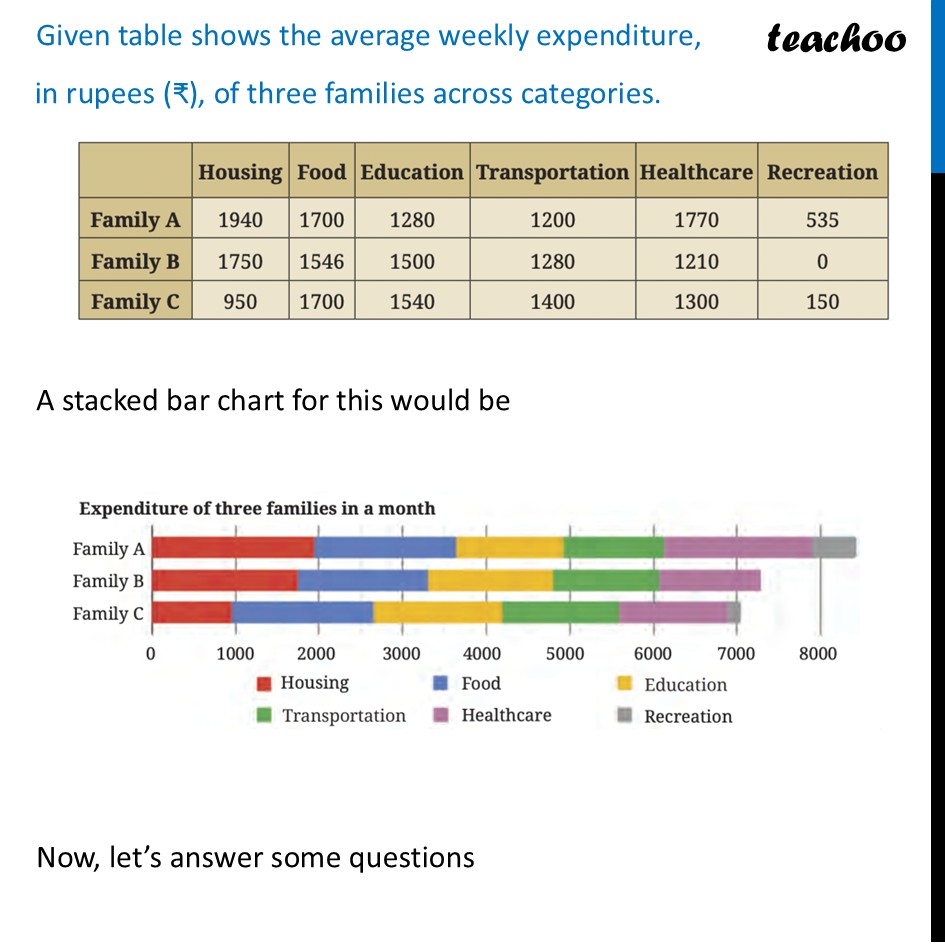
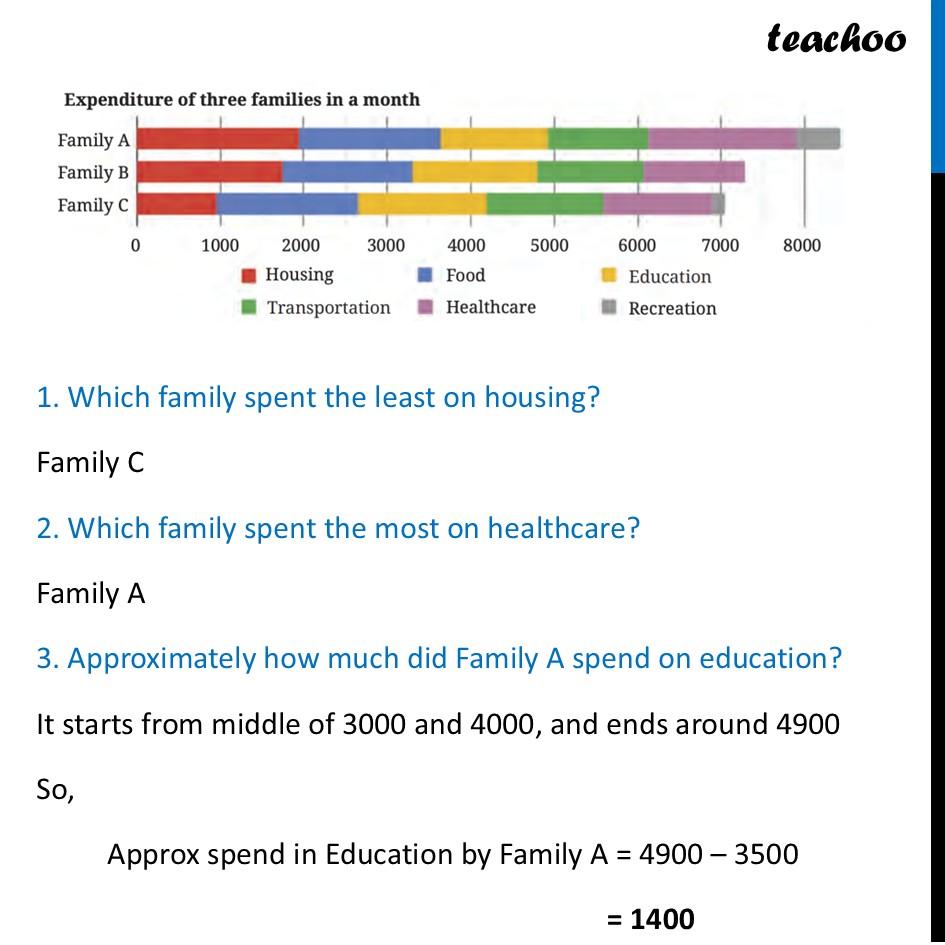
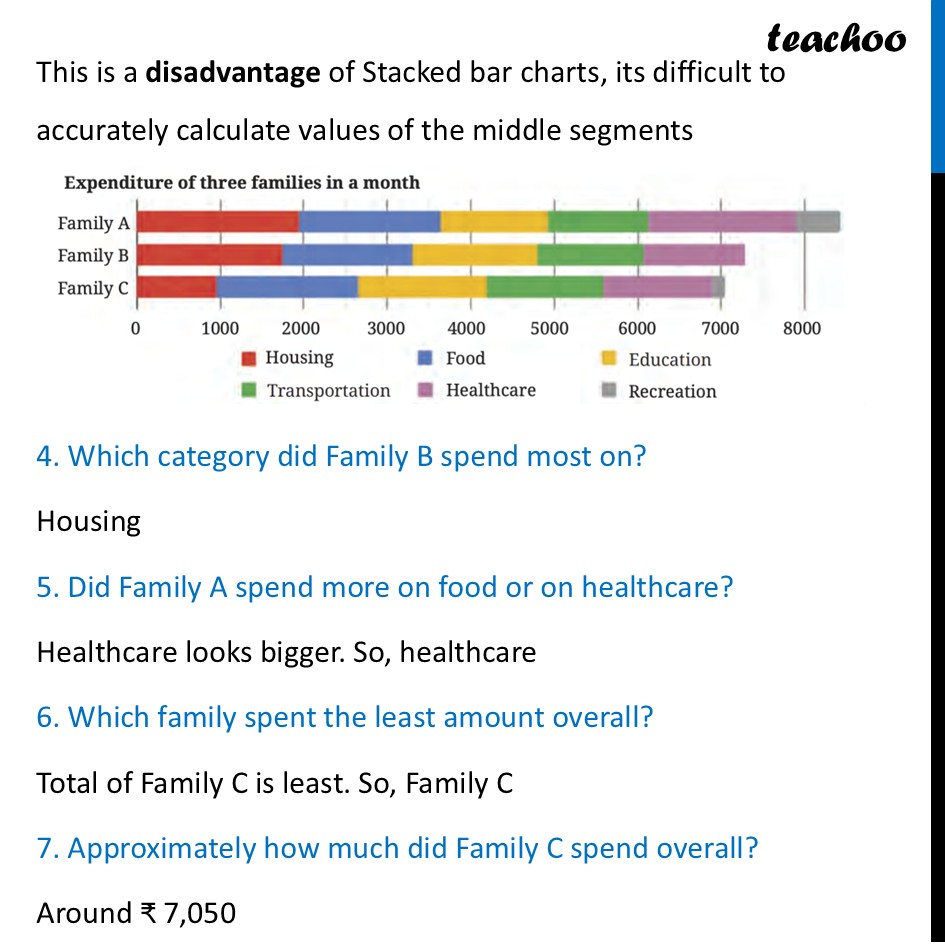
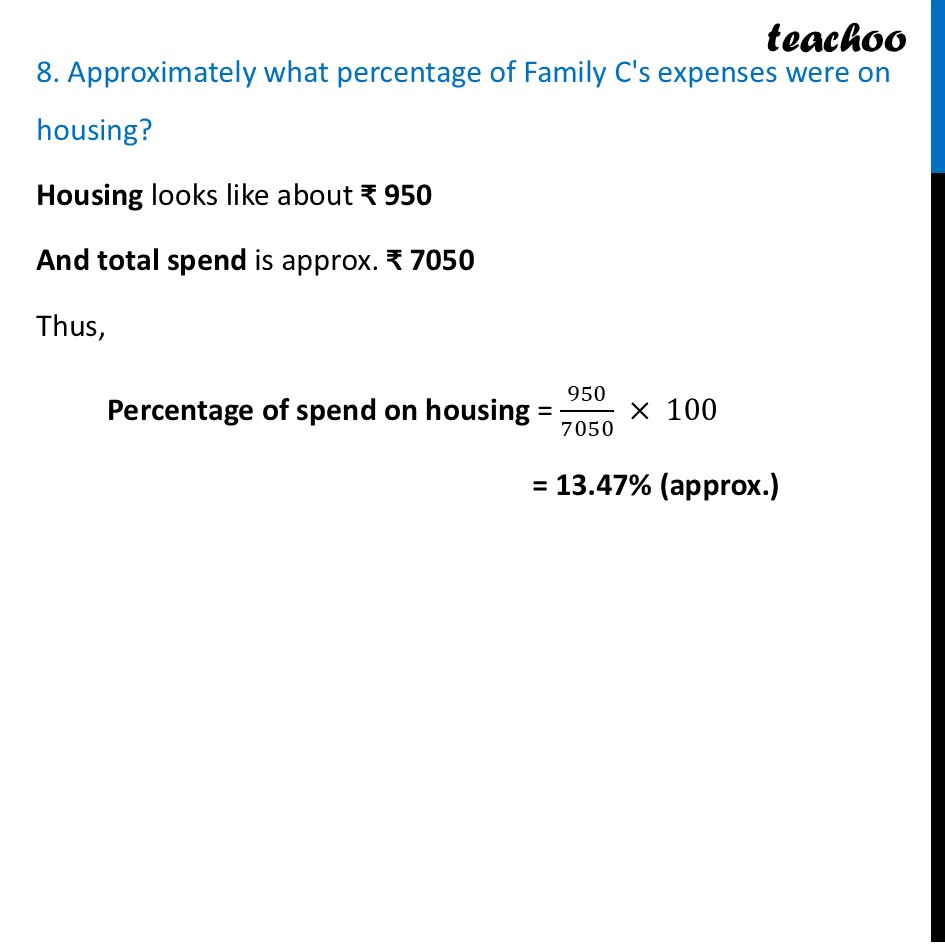
Stacked Bar Chart Stacked Bar Chart Stacked Column chart looks like this Here, height of each column represents the total, while the height of each segment within it represents the magnitude of that series. Daily hours spent with digital media in the United States Average daily hours spent engaging with digital media (e.g., images and videos, web pages, social media apps, etc.) The data for ‘other connected devices’ includes game consoles. Mobile includes smartphones & tablets. All data includes usage at home and work for people 18+. —8 Table ku! Column 7 hours BH Mobile H Desktop/Laptop @ Other connected devices 6 hours 5 hours 4 hours 3 hours 2 hours 1 hours O hours 2008 2009 2010 2011 2012 2013 2014 2015 2016 2017 2018 Similarly, a stacked Bar chart looks like Stacked bar charts are perfect for multi-dimensional data where you need to show both a total value and how that total is broken down into sub-categories. Let’s do an example Sun Sat Fri Thu Wed Tue $40 $60 $80 $100 $120 $140 $160 $180 $200 @ Meals Hi Snacks $220 $240 $260 $280 $300 $320 $340 $360 $380 $400 Drinks Dessert [J Takeaway $420 Given table shows the average weekly expenditure, in rupees (₹), of three families across categories. A stacked bar chart for this would be Now, let’s answer some questions Housing | Food | Education | Transportation |Healthcare| Recreation Famiva| 90 |vo| ww | on | Family B |} 1750 | 1546 1500 1280 1210 Family C 950 1700 1540 1400 1300 150 Expenditure of three families in a month Family A Family B Family C 0 1000 2000 3000 4000 5000 6000 7000 8000 @ Housing ®@ Food © Education ® Transportation @ Healthcare ™ Recreation 1. Which family spent the least on housing? Family C 2. Which family spent the most on healthcare? Family A 3. Approximately how much did Family A spend on education? It starts from middle of 3000 and 4000, and ends around 4900 So, Approx spend in Education by Family A = 4900 – 3500 = 1400 4. Which category did Family B spend most on? 5. Did Family A spend more on food or on healthcare? 6. Which family spent the least amount overall? 7. Approximately how much did Family C spend overall? 8. Approximately what percentage of Family C's expenses were on housing? Expenditure of three families in a month Family B 0 1000 2000 3000 4000 5000 6000 7000 8000 @ Housing ®@ Food © Education ® Transportation @ Healthcare ™ Recreation This is a disadvantage of Stacked bar charts, its difficult to accurately calculate values of the middle segments 4. Which category did Family B spend most on? Housing 5. Did Family A spend more on food or on healthcare? Healthcare looks bigger. So, healthcare 6. Which family spent the least amount overall? Total of Family C is least. So, Family C 7. Approximately how much did Family C spend overall? Around ₹ 7,050 8. Approximately what percentage of Family C's expenses were on housing? Expenditure of three families in a month Family A Family B Family C 0 1000 2000 3000 4000 5000 6000 7000 8000 @ Housing ®@ Food © Education ® Transportation @ Healthcare ™ Recreation 8. Approximately what percentage of Family C's expenses were on housing? Housing looks like about ₹ 950 And total spend is approx. ₹ 7050 Thus, Percentage of spend on housing = (950)/(7050) × 100 = 13.47% (approx.)