You are here
Stacked Bar or Column Chart
Last updated at October 23, 2026 by Teachoo
Transcript
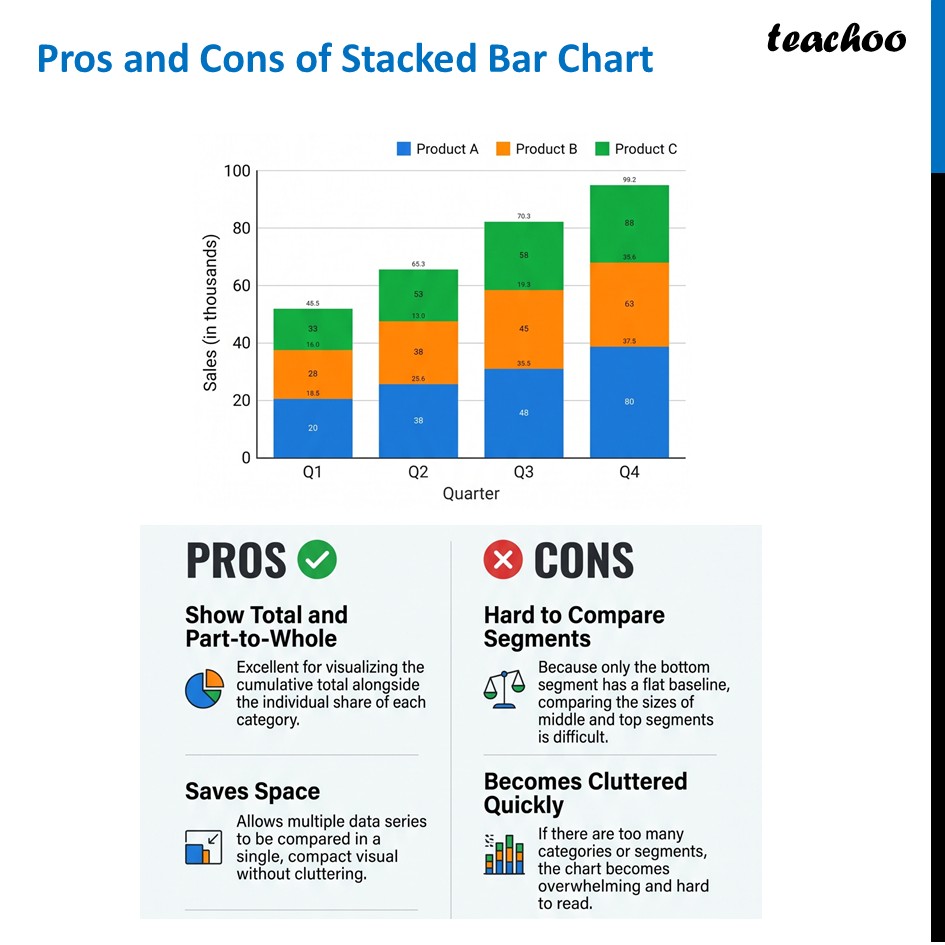
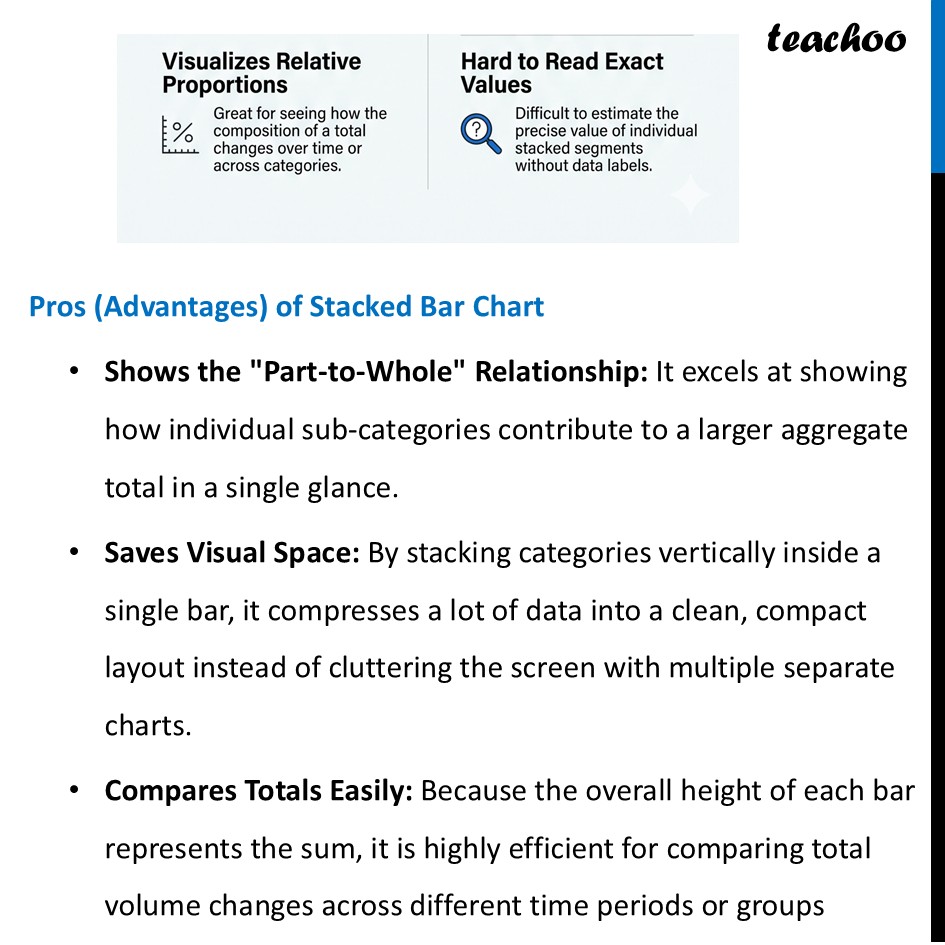
Pros and Cons of Stacked Bar Chart PROS & CONS OF STACKED BAR CHARTS Mi ProductA {§ ProductB [Product C 100 aS a ioe] oO Oo oO Sales (in thousands) N fo) Ql Q2 PROS @ Show Total and Part-to-Whole Excellent for visualizing the aN cumulative total alongside the individual share of each category. Saves Space Allows multiple data series mh to be compared in a single, compact visual without cluttering. Visualizes Relative Proportions 4 Great for seeing how the Jey composition of a total changes over time or across categories. 99.2 Q3 Q4 Quarter © CONS Hard to Compare Segments Because only the bottom 6fé segment has a flat baseline, comparing the sizes of middle and top segments is difficult. Becomes Cluttered Quickly = If there are too many all categories or segments, the chart becomes overwhelming and hard to read. Hard to Read Exact Values Difficult to estimate the Q precise value of individual stacked segments without data labels. Pros (Advantages) of Stacked Bar Chart Shows the "Part-to-Whole" Relationship: It excels at showing how individual sub-categories contribute to a larger aggregate total in a single glance. Saves Visual Space: By stacking categories vertically inside a single bar, it compresses a lot of data into a clean, compact layout instead of cluttering the screen with multiple separate charts. Compares Totals Easily: Because the overall height of each bar represents the sum, it is highly efficient for comparing total volume changes across different time periods or groups PROS & CONS OF STACKED BAR CHARTS Mi ProductA {§ ProductB [Product C 100 aS a ioe] oO Oo oO Sales (in thousands) N fo) Ql Q2 PROS @ Show Total and Part-to-Whole Excellent for visualizing the aN cumulative total alongside the individual share of each category. Saves Space Allows multiple data series mh to be compared in a single, compact visual without cluttering. Visualizes Relative Proportions 4 Great for seeing how the Jey composition of a total changes over time or across categories. 99.2 Q3 Q4 Quarter © CONS Hard to Compare Segments Because only the bottom 6fé segment has a flat baseline, comparing the sizes of middle and top segments is difficult. Becomes Cluttered Quickly = If there are too many all categories or segments, the chart becomes overwhelming and hard to read. Hard to Read Exact Values Difficult to estimate the Q precise value of individual stacked segments without data labels. Flexible Layouts: You can easily pivot to a 𝟏𝟎𝟎% stacked layout if your primary goal changes from comparing absolute amounts to comparing percentage distributions. Cons (Disadvantages) of Stacked Bar Chart Hard to Compare Middle Segments: Only the very bottom segment sits on a flat, consistent baseline (zero). Because the middle and top segments start and end at varying heights, the human brain struggles to accurately judge and compare their exact sizes across bars. Becomes Cluttered Quickly: If you try to stack more than 4 or 5 segments inside a single bar, the chart becomes visually overwhelming and difficult to read. Prone to Misinterpretation: Without clear labels or interactive hover tooltips, it is very easy for users to mistake a standard stacked chart for a 100% stacked chart, leading to incorrect data assumptions. Negative Values Cause Problems: If your dataset includes negative numbers (e.g., net profits and losses), stacking them breaks the visual logic, making the chart messy and confusing. Exercise Set 10.4