You are here
End-of-Chapter Exercises
Last updated at October 23, 2026 by Teachoo
Transcript
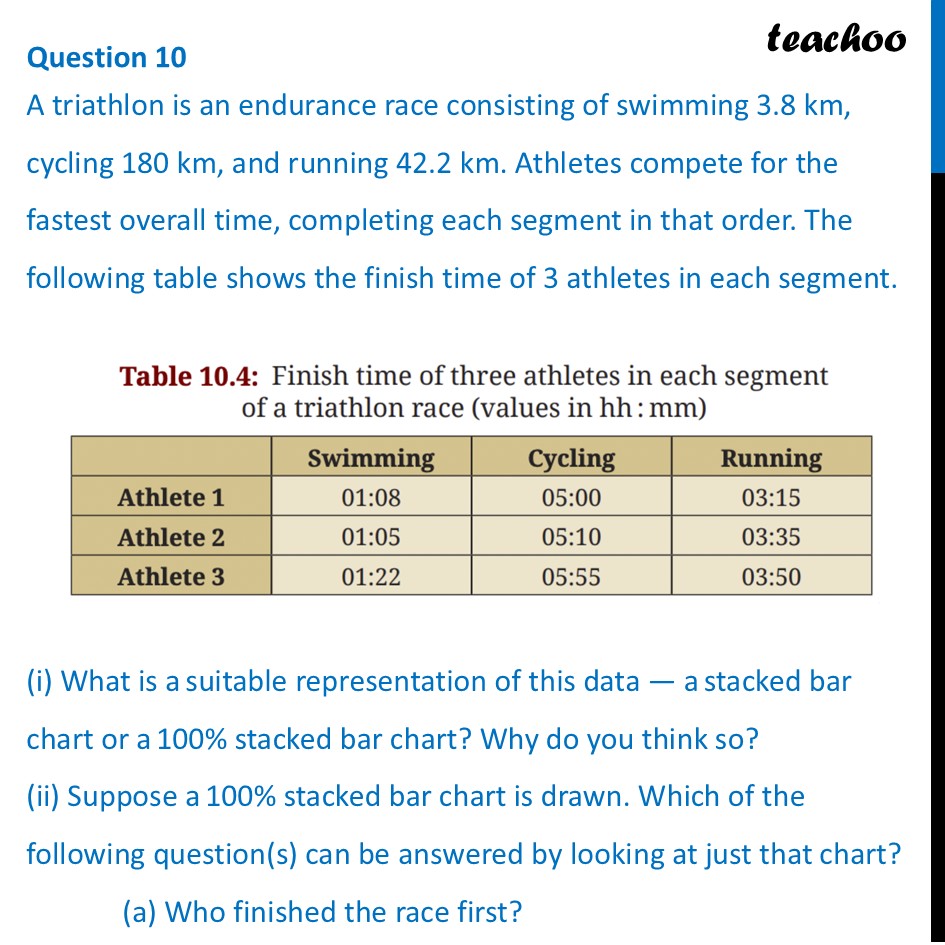
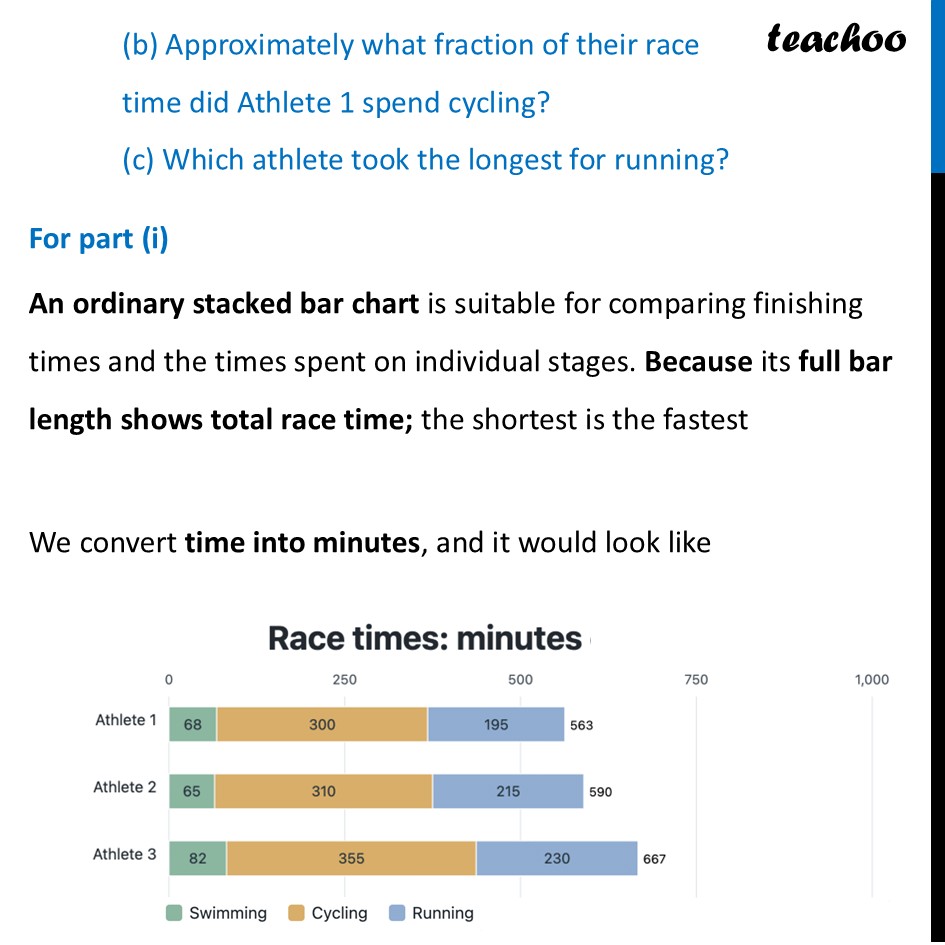
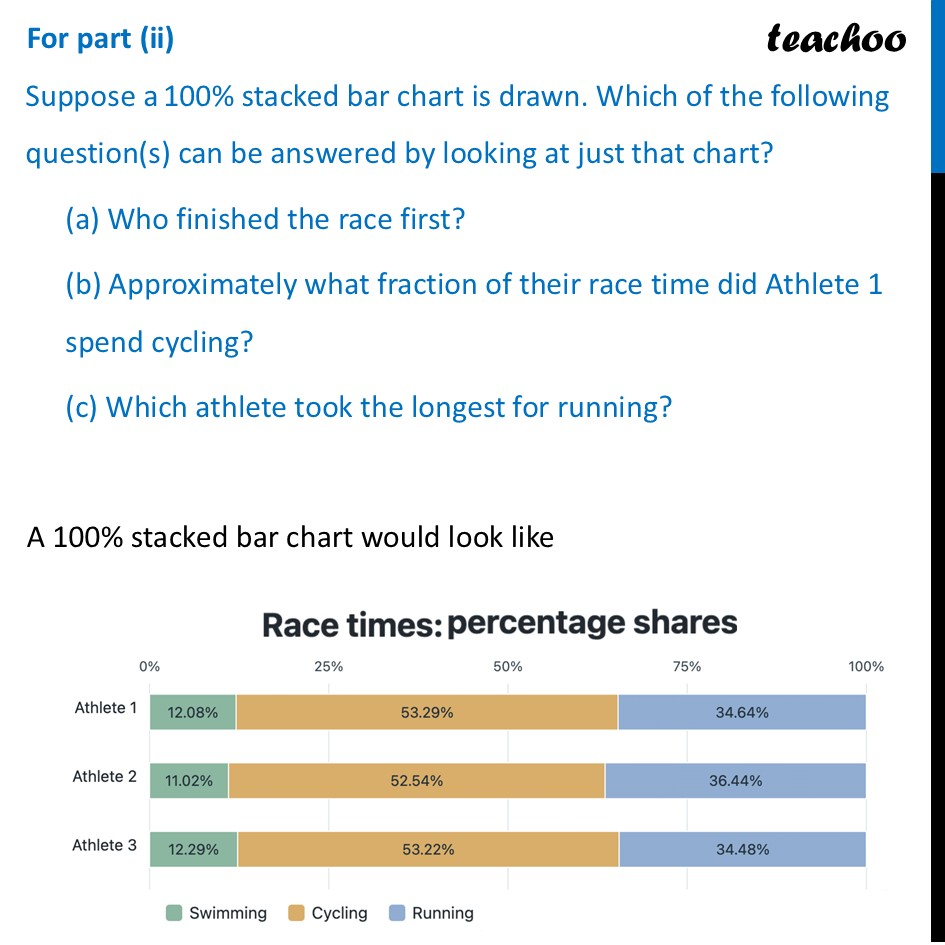
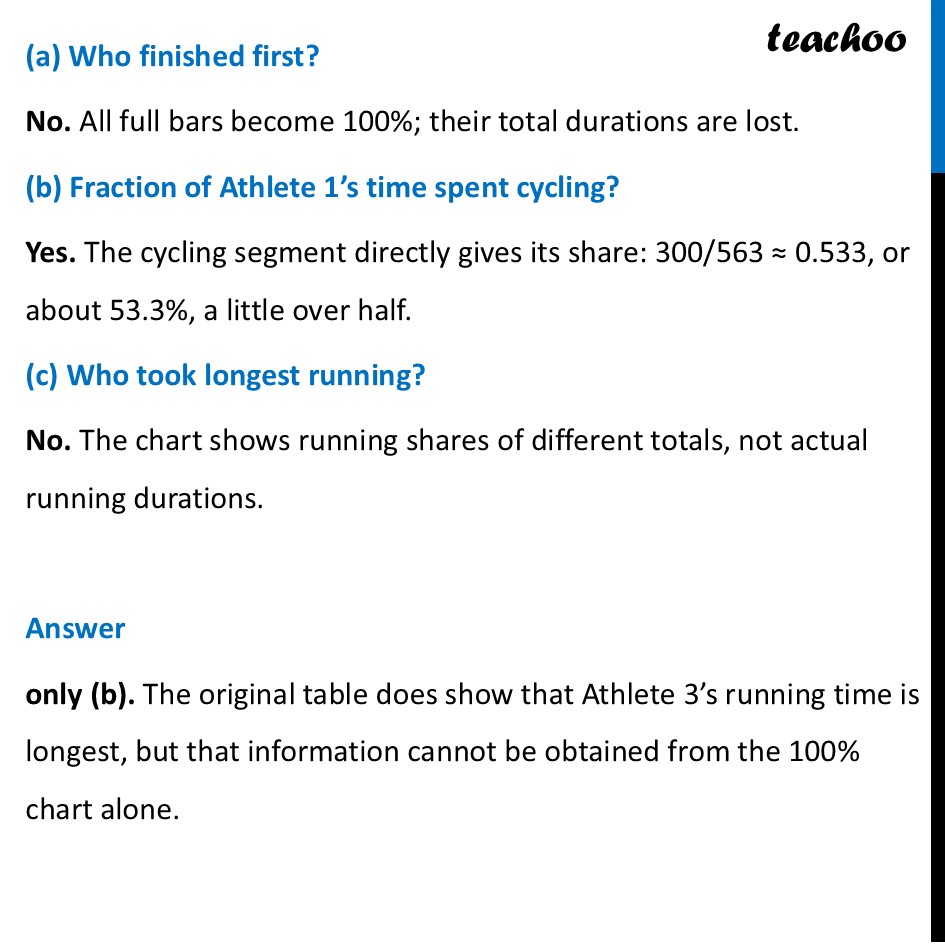
Question 10 A triathlon is an endurance race consisting of swimming 3.8 km, cycling 180 km, and running 42.2 km. Athletes compete for the fastest overall time, completing each segment in that order. The following table shows the finish time of 3 athletes in each segment. (i) What is a_( )suitable representation of this data — a_( )stacked bar chart or a_( )100% stacked bar chart? Why do you think so? (ii) Suppose a_( )100% stacked bar chart is drawn. Which of the following question(s) can be answered by looking at just that chart? (a) Who finished the race first? (b) Approximately what fraction of their race time did Athlete 1 spend cycling? (c) Which athlete took the longest for running? Table 10.4: Finish time of three athletes in each segment of a triathlon race (values in hh: mm) Running Athlete 1 03:15 Athlete 2 03:35 Athlete 3 01:22 05:55 03:50 (b) Approximately what fraction of their race time did Athlete 1 spend cycling? (c) Which athlete took the longest for running? For part (i) An ordinary stacked bar chart is suitable for comparing finishing times and the times spent on individual stages. Because its full bar length shows total race time; the shortest is the fastest We convert time into minutes, and it would look like 750 1,000 0 250 500 Race times: minutes or percentage shares © Swimming Cycling ® Running For part (ii) Suppose a_( )100% stacked bar chart is drawn. Which of the following question(s) can be answered by looking at just that chart? (a) Who finished the race first? (b) Approximately what fraction of their race time did Athlete 1 spend cycling? (c) Which athlete took the longest for running? A 100% stacked bar chart would look like 0% 25% 50% 75% 100% Race times: minutes or percentage shares © Swimming Cycling ® Running (a) Who finished first? No. All full bars become 100%; their total durations are lost. (b) Fraction of Athlete 1’s time spent cycling? Yes. The cycling segment directly gives its share: 300/563 ≈ 0.533, or about 53.3%, a little over half. (c) Who took longest running? No. The chart shows running shares of different totals, not actual running durations. Answer only (b). The original table does show that Athlete 3’s running time is longest, but that information cannot be obtained from the 100% chart alone.