

Visualising Linear Relationships
![]()
![]()
![]()
![]()
![]()
![]()
![]()
![]()
![]()
![]()
![]()
![]()
Last updated at May 6, 2026 by Teachoo
Transcript
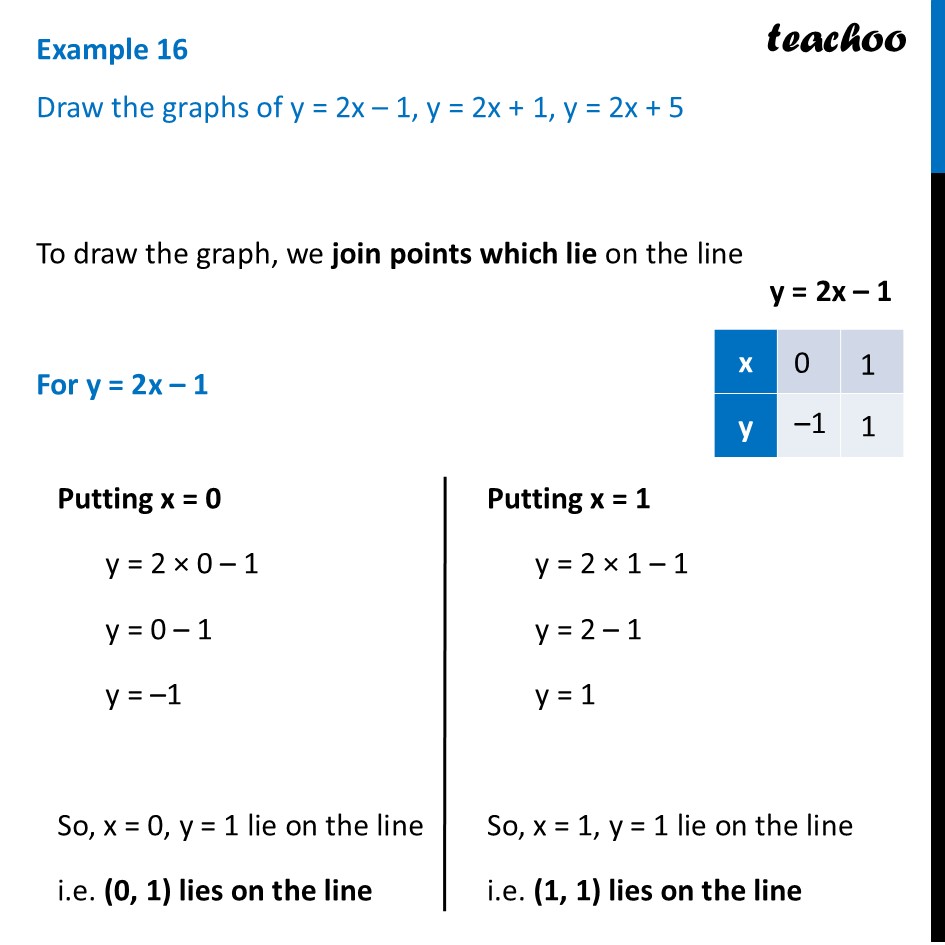
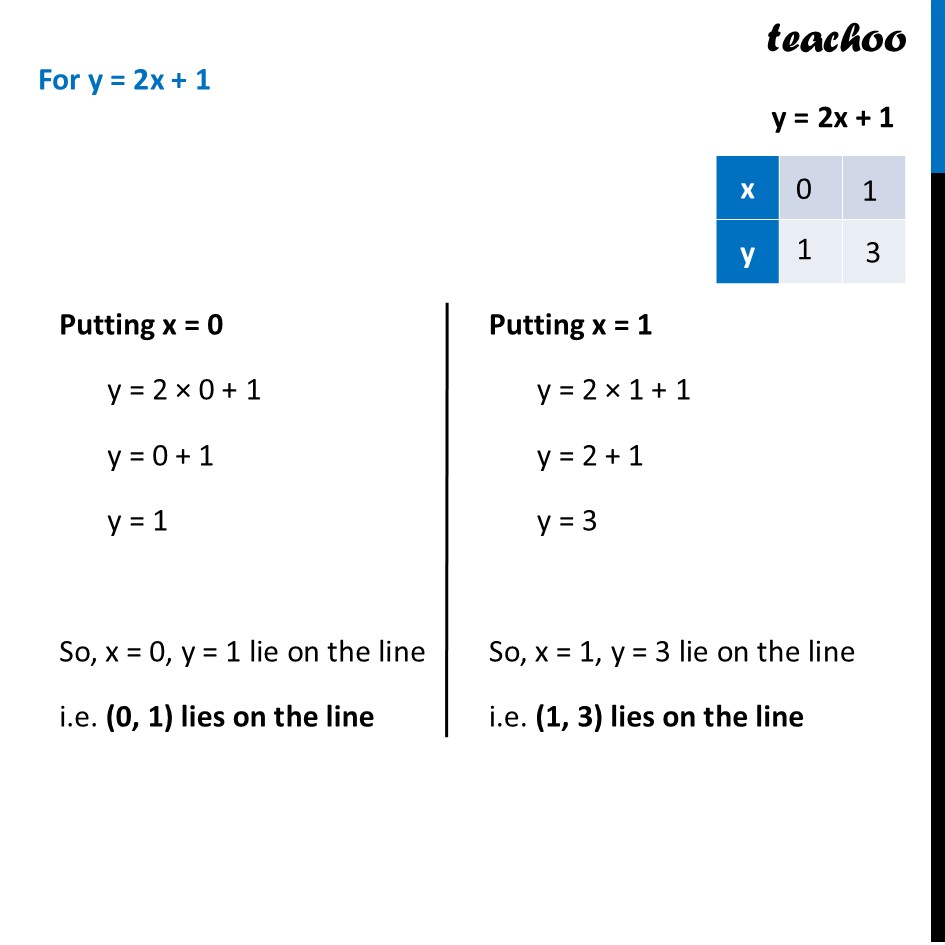
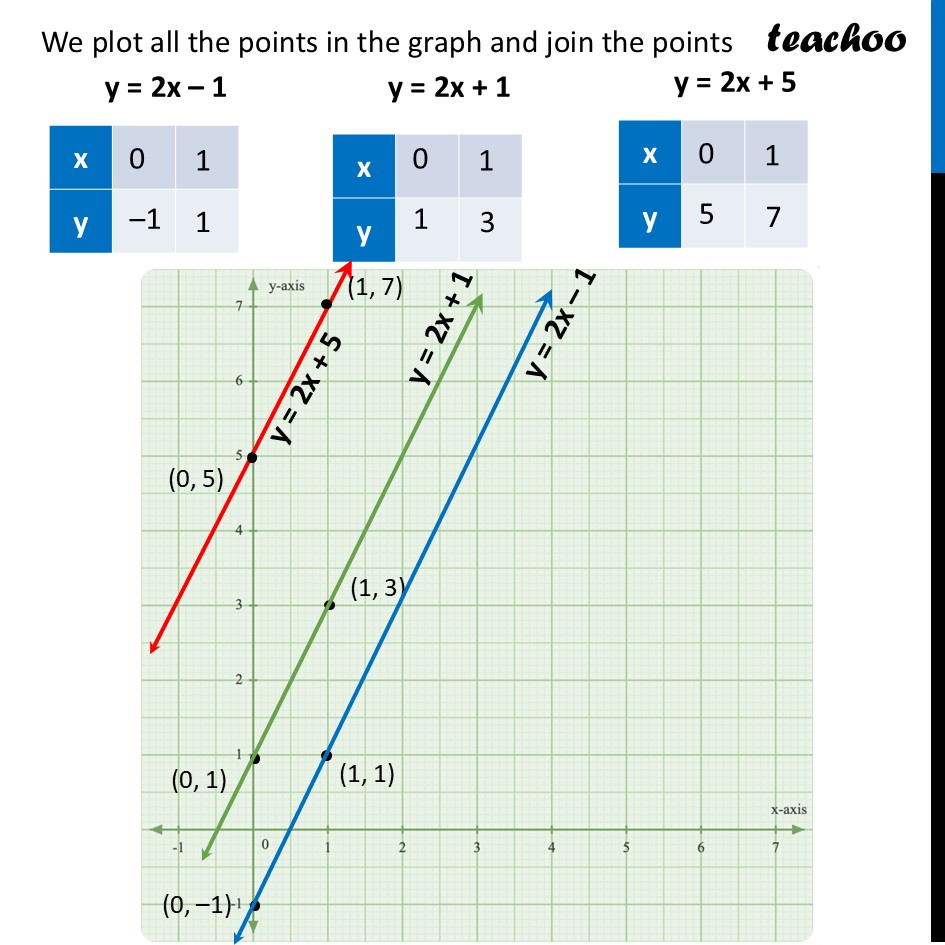
Example 16 Draw the graphs of y = 2x – 1, y = 2x + 1, y = 2x + 5 To draw the graph, we join points which lie on the line For y = 2x – 1 Putting x = 0 y = 2 × 0 – 1 y = 0 – 1 y = –1 So, x = 0, y = 1 lie on the line i.e. (0, 1) lies on the line Putting x = 1 y = 2 × 1 – 1 y = 2 – 1 y = 1 So, x = 1, y = 1 lie on the line i.e. (1, 1) lies on the line For y = 2x + 1 Putting x = 0 y = 2 × 0 + 1 y = 0 + 1 y = 1 So, x = 0, y = 1 lie on the line i.e. (0, 1) lies on the line Putting x = 1 y = 2 × 1 + 1 y = 2 + 1 y = 3 So, x = 1, y = 3 lie on the line i.e. (1, 3) lies on the line For y = 2x + 5 Putting x = 0 y = 2 × 0 + 5 y = 0 + 5 y = 5 So, x = 0, y = 5 lie on the line i.e. (0, 5) lies on the line Putting x = 1 y = 2 × 1 + 5 y = 2 + 5 y = 7 So, x = 1, y = 7 lie on the line i.e. (1, 7) lies on the line We plot all the points in the graph and join the points y = 2x – 1 y = 2x + 1 y = 2x + 5 Here, we observe that for Since they have same value of slope (a) – they are parallel They have different y-intercepts as value of b is different
