![Slope of a Line - Definition and Significace [with Examples] - Teachoo - Visualising Linear Relationships](https://cdn.teachoo.com/19ee0b65-2bae-4045-a41b-3f2c8c3c9869/slide7.jpg)
Visualising Linear Relationships
![]()
![]()
![]()
![]()
![]()
![]()
![]()
![]()
![]()
![]()
![]()
![]()
Last updated at May 6, 2026 by Teachoo
Transcript
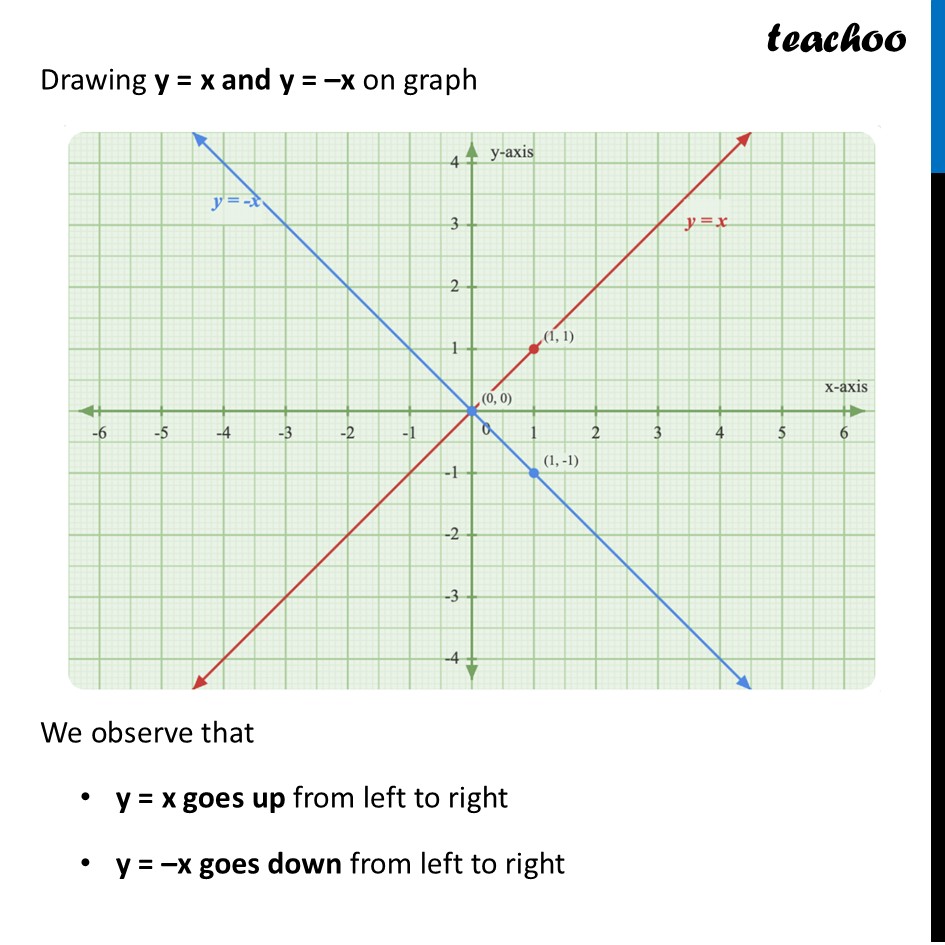
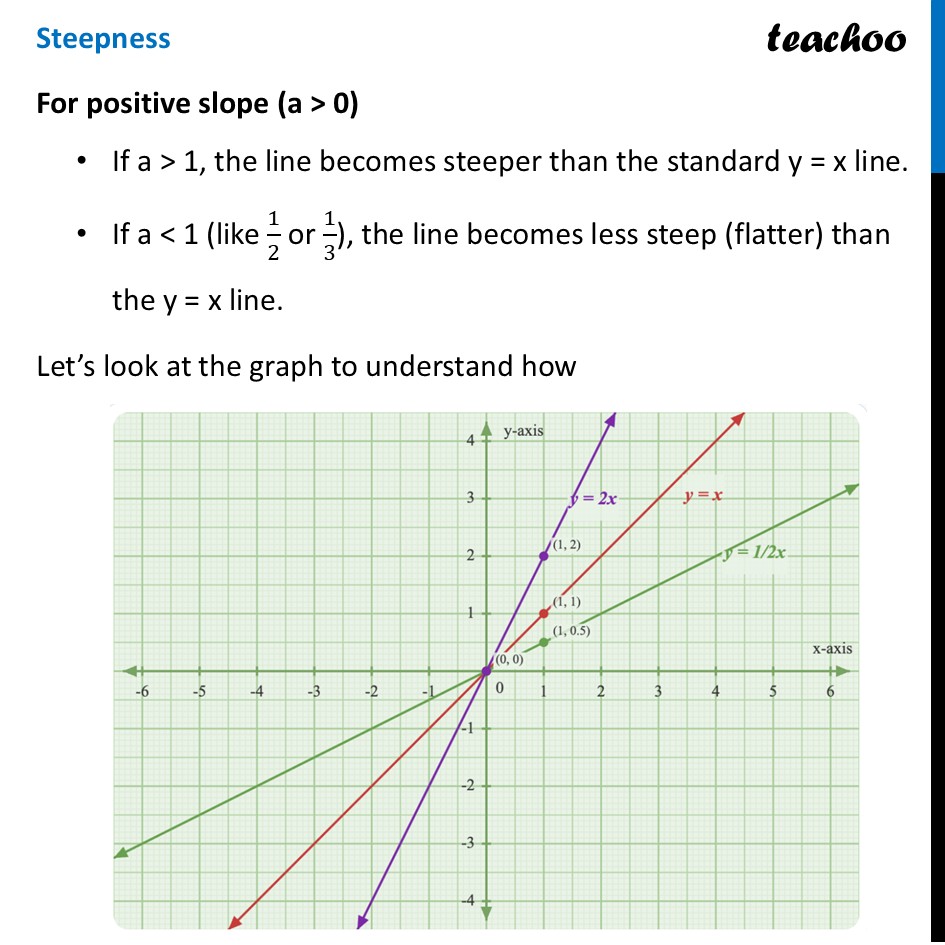
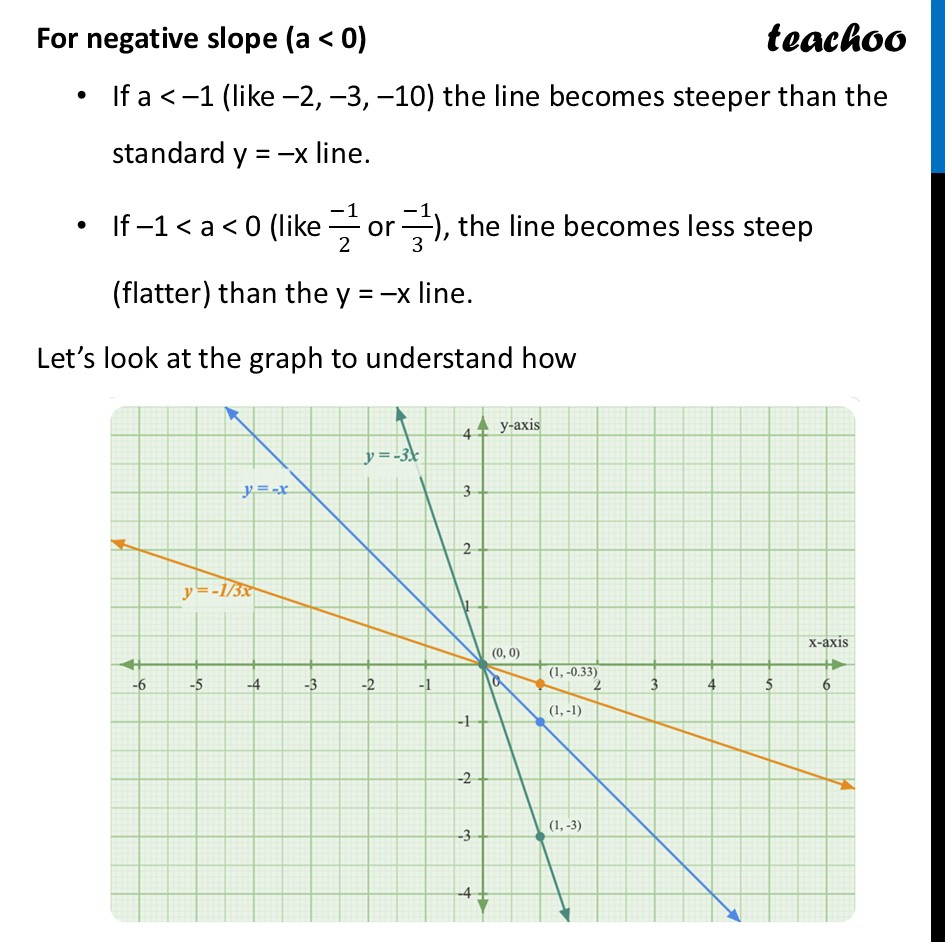
Slope of a Line For any line y = ax + b, a is the slope b is the y-intercept Let’s look at slope here Slope (the number a) controls the steepness and direction of the line. Direction When a > 0: line goes up from left to right When a < 0: line goes down from left to right Let’s look at the graph ˚to understand how Drawing y = x and y = –x on graph We observe that y = x goes up from left to right y = –x goes down from left to right Steepness For positive slope (a > 0) If a > 1, the line becomes steeper than the standard y = x line. If a < 1 (like 1/2 or 1/3), the line becomes less steep (flatter) than the y = x line. Let’s look at the graph to understand how For negative slope (a < 0) If a < –1 (like –2, –3, –10) the line becomes steeper than the standard y = –x line. If –1 < a < 0 (like (−1)/2 or (−1)/3), the line becomes less steep (flatter) than the y = –x line. Let’s look at the graph to understand how
