Visualising Linear Relationships
![]()
![]()
![]()
![]()
![]()
![]()
![]()
![]()
![]()
![]()
![]()
![]()
Last updated at May 6, 2026 by Teachoo
Transcript
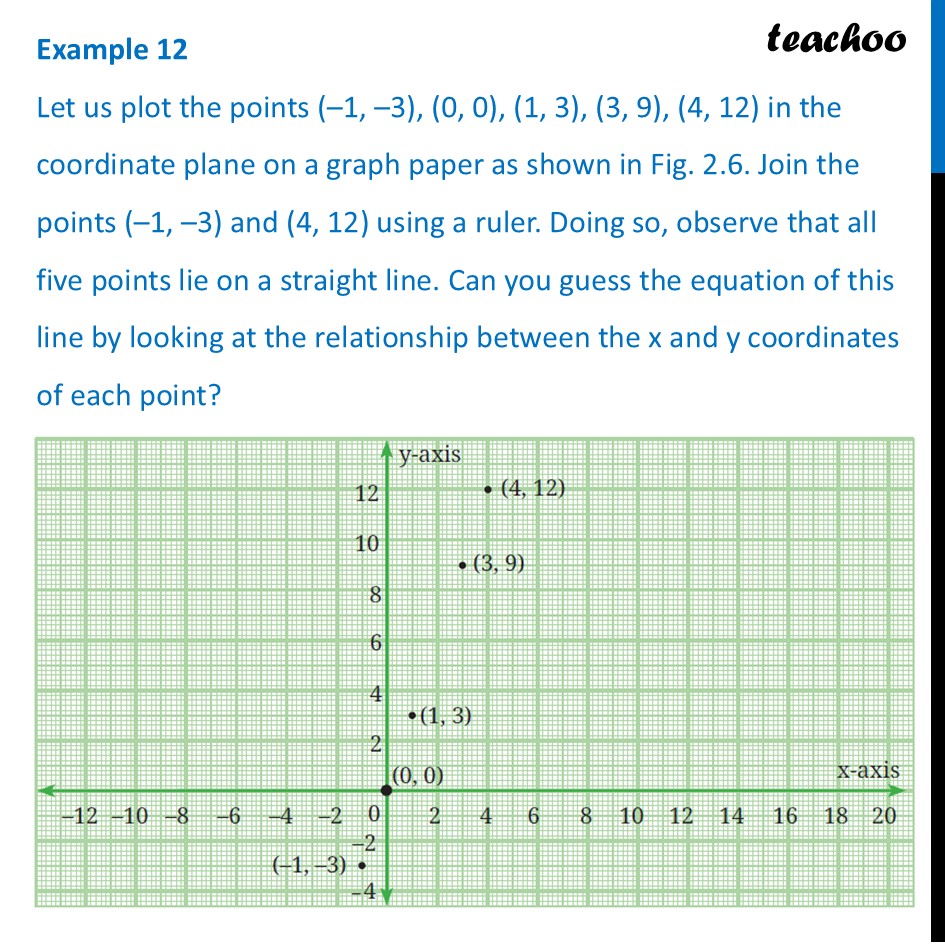
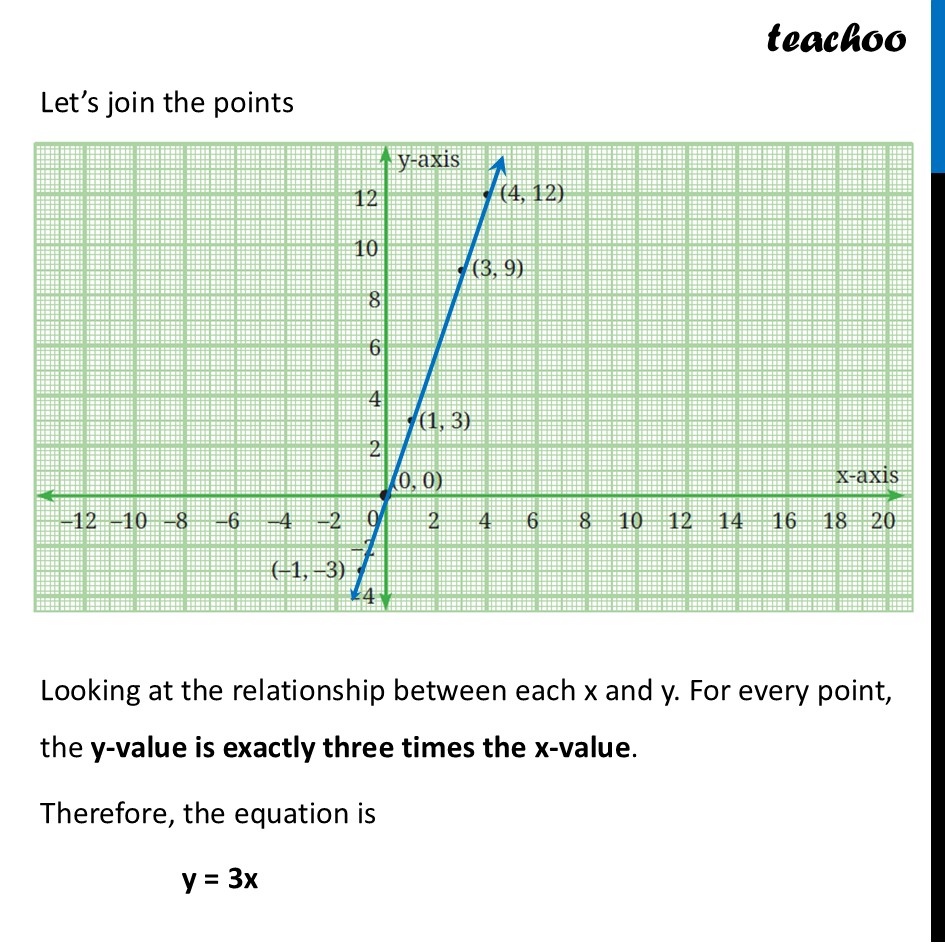
Example 12 Let us plot the points (–1, –3), (0, 0), (1, 3), (3, 9), (4, 12) in the coordinate plane on a graph paper as shown in Fig. 2.6. Join the points (–1, –3) and (4, 12) using a ruler. Doing so, observe that all five points lie on a straight line. Can you guess the equation of this line by looking at the relationship between the x and y coordinates of each point? Let’s join the points Looking at the relationship between each x and y. For every point, the y-value is exactly three times the x-value. Therefore, the equation is y = 3x
