Visualising Linear Relationships
![]()
![]()
![]()
![]()
![]()
![]()
![]()
![]()
![]()
![]()
![]()
![]()
Last updated at May 6, 2026 by Teachoo
Transcript
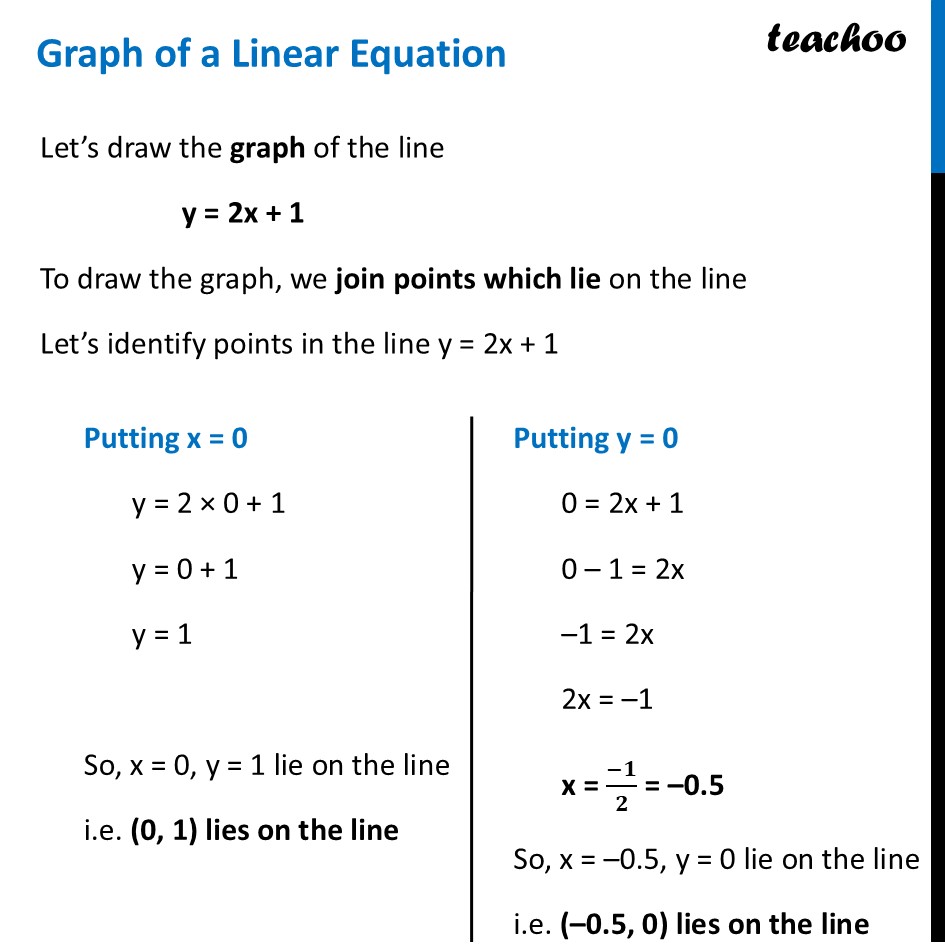
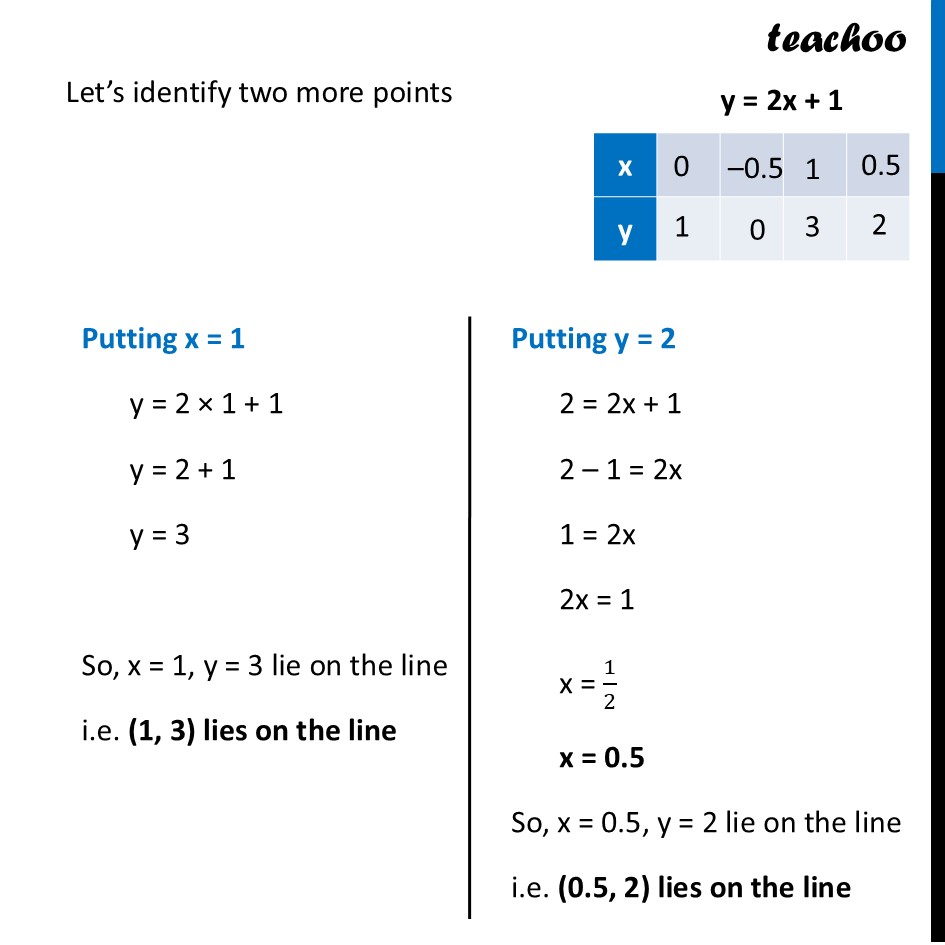
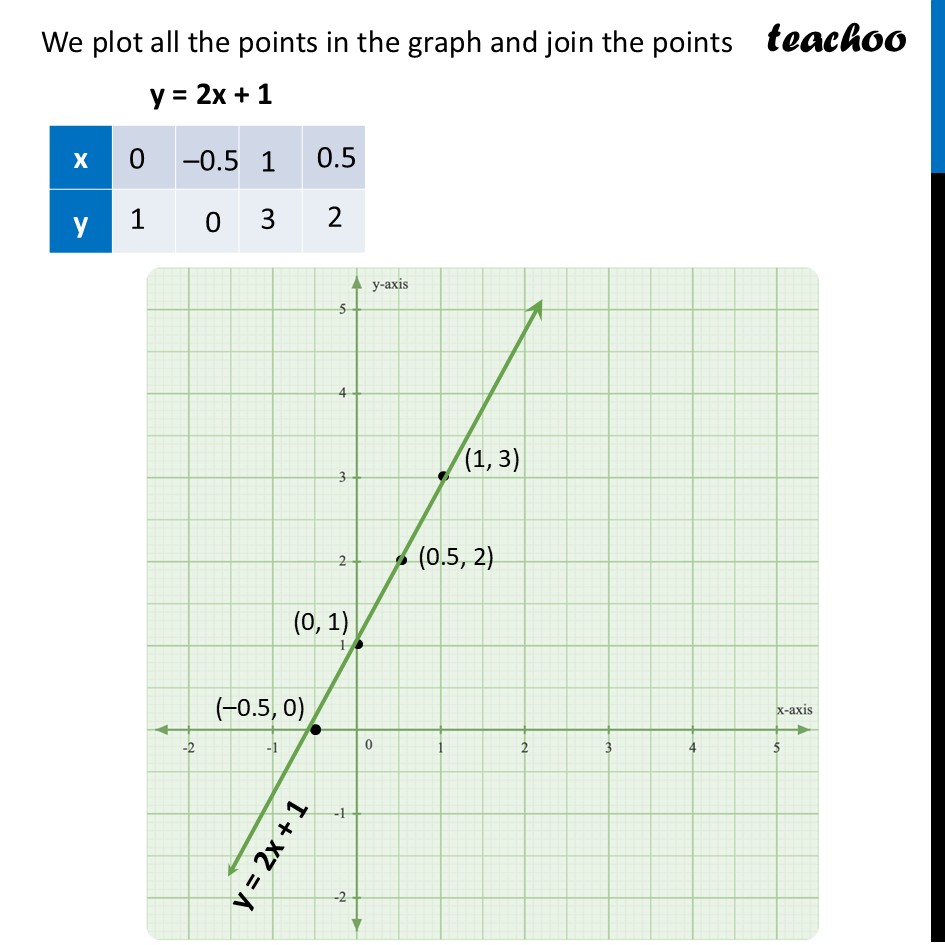
Graph of a Linear Equation Let’s draw the graph of the line y = 2x + 1 To draw the graph, we join points which lie on the line Let’s identify points in the line y = 2x + 1 Putting x = 0 y = 2 × 0 + 1 y = 0 + 1 y = 1 So, x = 0, y = 1 lie on the line i.e. (0, 1) lies on the line Putting y = 0 0 = 2x + 1 0 – 1 = 2x –1 = 2x 2x = –1 x = (−𝟏)/𝟐 = –0.5 So, x = –0.5, y = 0 lie on the line i.e. (–0.5, 0) lies on the line Let’s identify two more points Putting x = 1 y = 2 × 1 + 1 y = 2 + 1 y = 3 So, x = 1, y = 3 lie on the line i.e. (1, 3) lies on the line Putting y = 2 2 = 2x + 1 2 – 1 = 2x 1 = 2x 2x = 1 x = 1/2 x = 0.5 So, x = 0.5, y = 2 lie on the line i.e. (0.5, 2) lies on the line We plot all the points in the graph and join the points y = 2x + 1 Thus, by joining points on the line we get graph of the line Usually, we need only 2 points on the line to make its graph Similarly, we can make a graph of any line y = ax + b
