Visualising Linear Relationships
![]()
![]()
![]()
![]()
![]()
![]()
![]()
![]()
![]()
![]()
![]()
![]()
Last updated at May 6, 2026 by Teachoo
Transcript
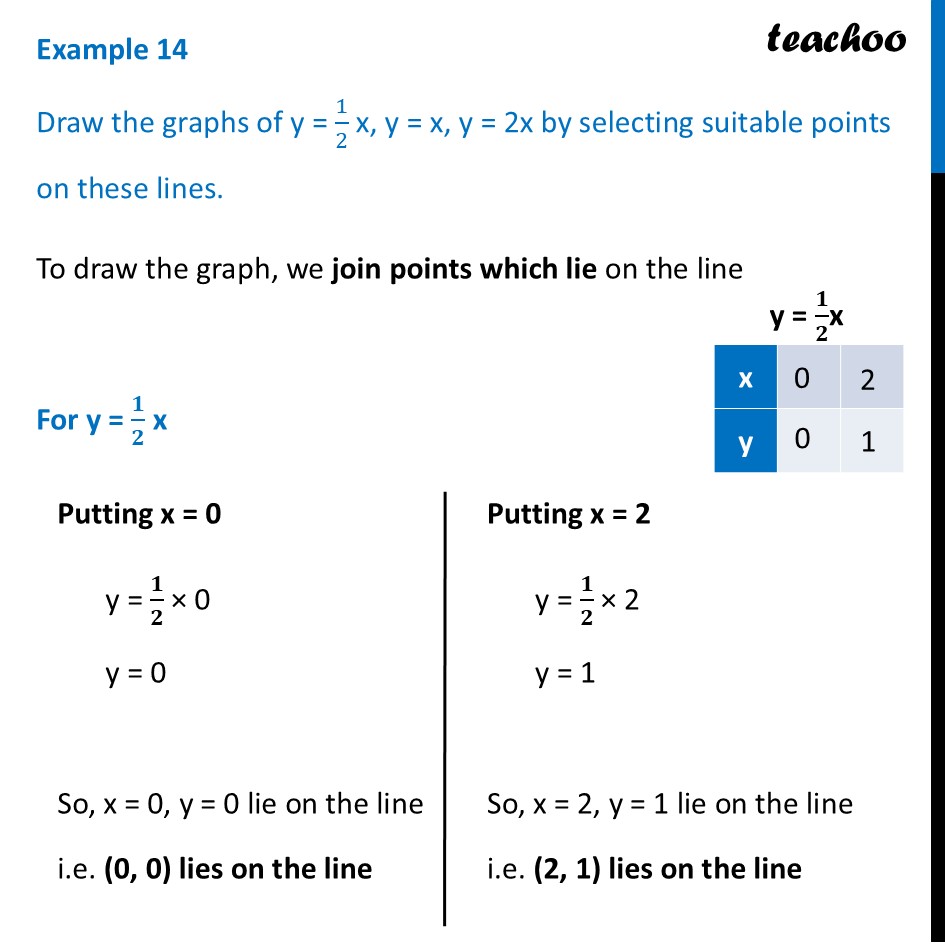
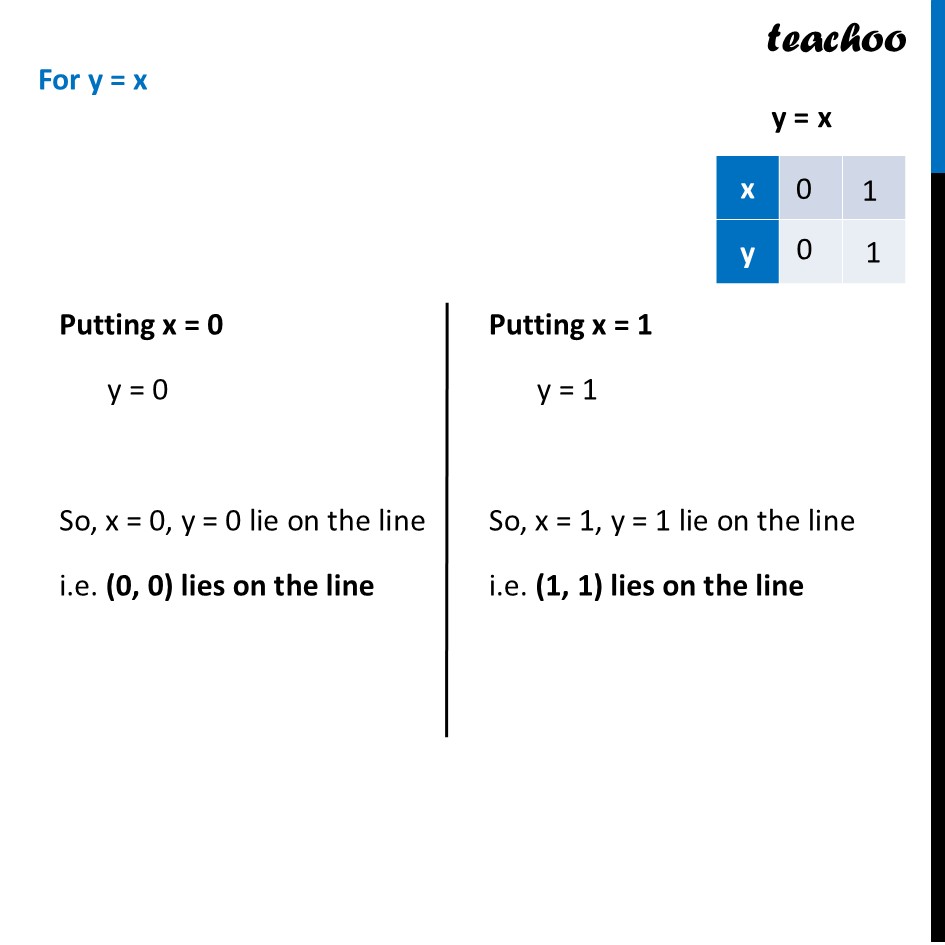
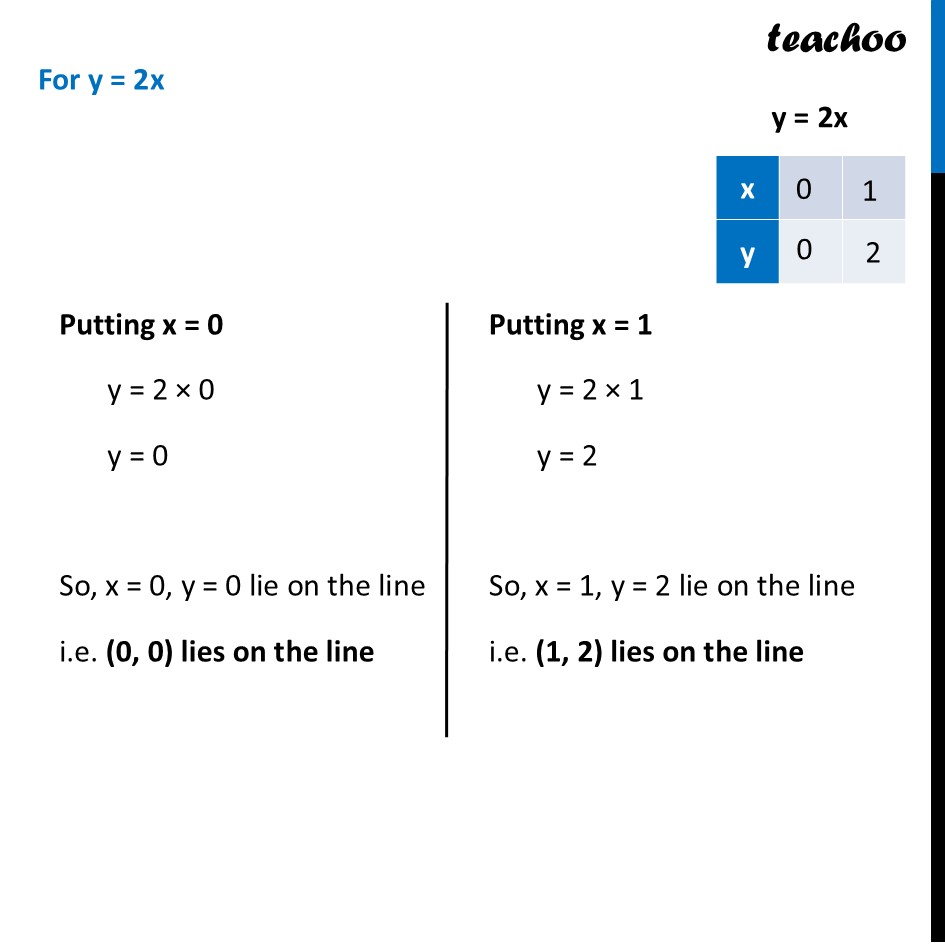
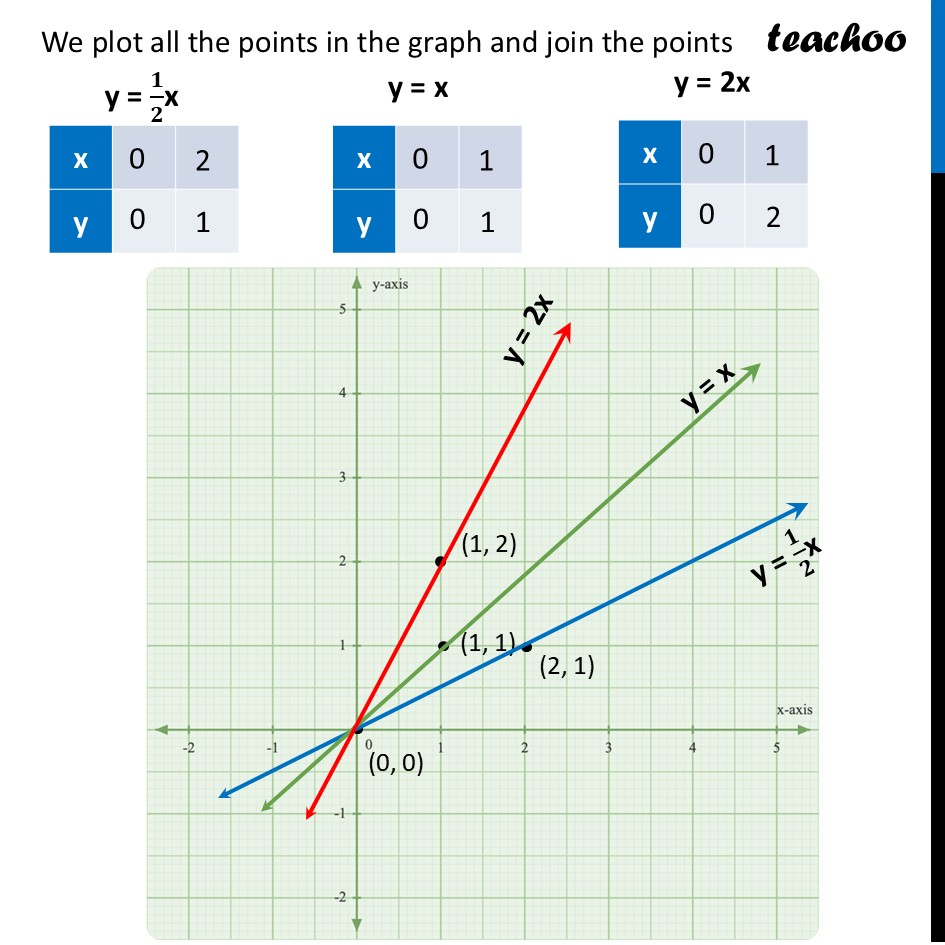
Example 14 Draw the graphs of y = 1/2 x, y = x, y = 2x by selecting suitable points on these lines. To draw the graph, we join points which lie on the line For y = 𝟏/𝟐 x Putting x = 0 y = 𝟏/𝟐 × 0 y = 0 So, x = 0, y = 0 lie on the line i.e. (0, 0) lies on the line Putting x = 2 y = 𝟏/𝟐 × 2 y = 1 So, x = 2, y = 1 lie on the line i.e. (2, 1) lies on the line For y = x Putting x = 0 y = 0 So, x = 0, y = 0 lie on the line i.e. (0, 0) lies on the line Putting x = 1 y = 1 So, x = 1, y = 1 lie on the line i.e. (1, 1) lies on the line For y = 2x Putting x = 0 y = 2 × 0 y = 0 So, x = 0, y = 0 lie on the line i.e. (0, 0) lies on the line Putting x = 1 y = 2 × 1 y = 2 So, x = 1, y = 2 lie on the line i.e. (1, 2) lies on the line We plot all the points in the graph and join the points y = 𝟏/𝟐x y = x y = 2x Thus, we observe that for line y = ax + b and a > 0 If a > 1, the line becomes steeper than the standard y = x line. If a < 1 (like 1/2 or 1/3), the line becomes less steep (flatter) than the y = x line.
