Visualising Linear Relationships
![]()
![]()
![]()
![]()
![]()
![]()
![]()
![]()
![]()
![]()
![]()
![]()
Last updated at May 6, 2026 by Teachoo
Transcript
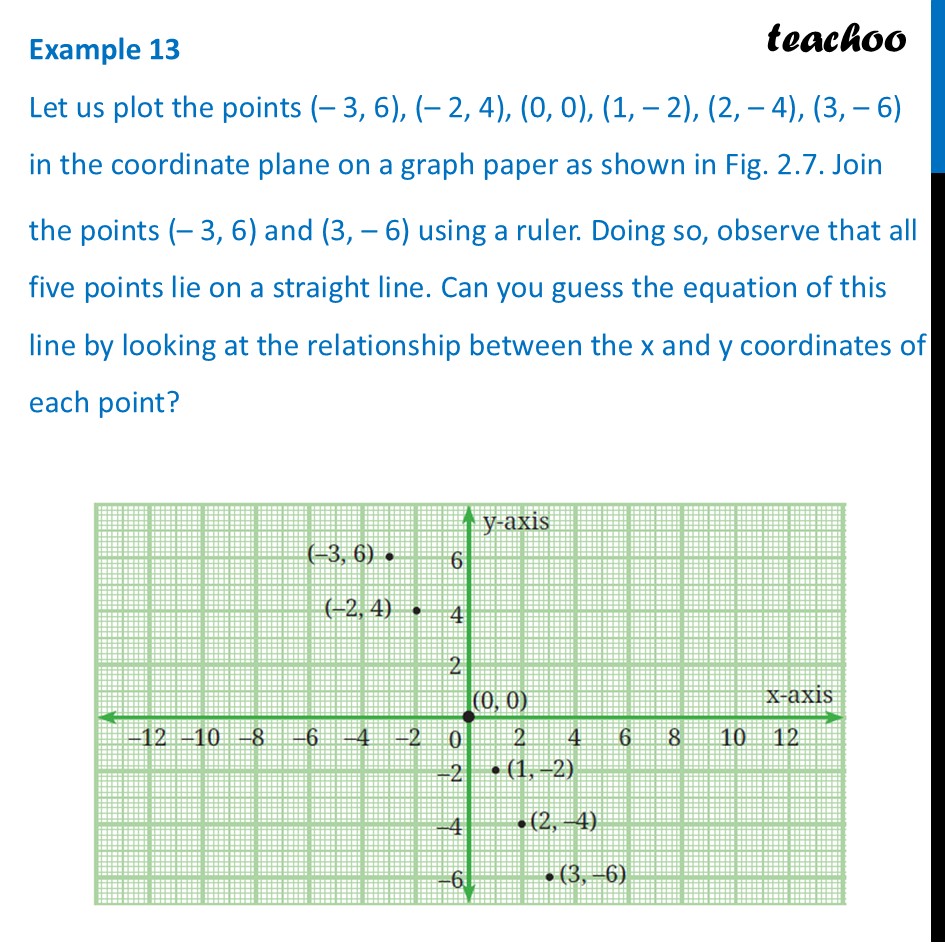
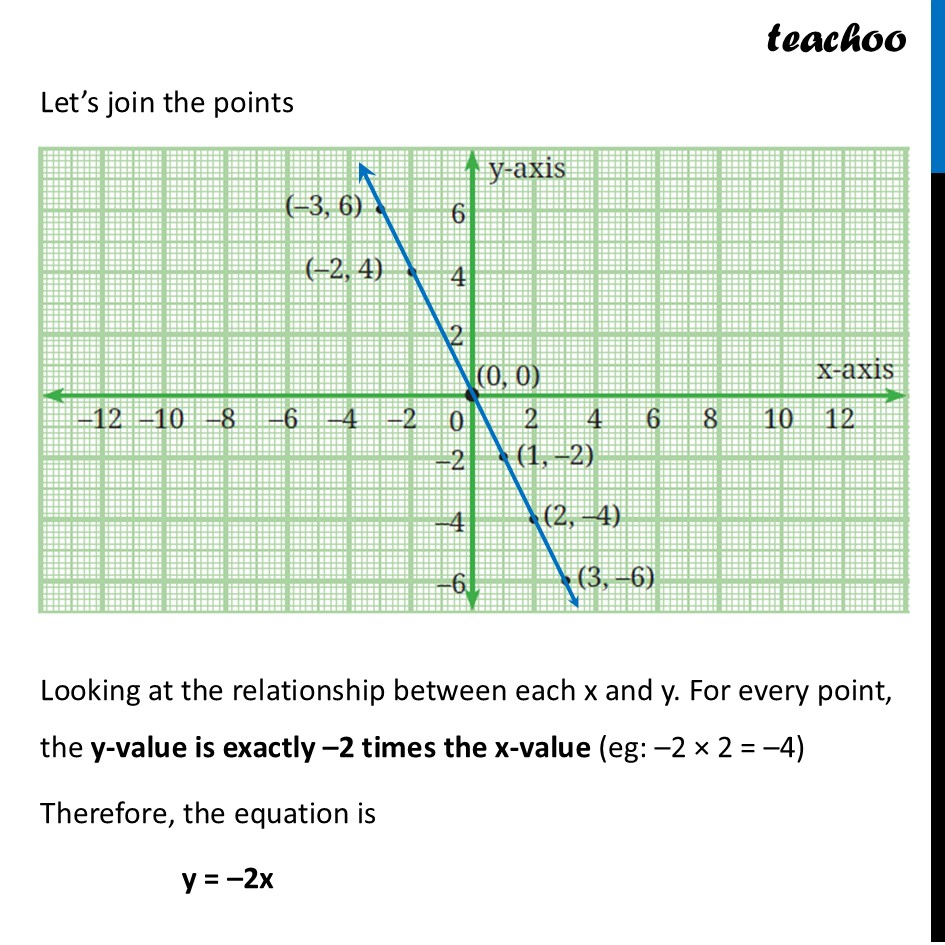
Example 13 Let us plot the points (– 3, 6), (– 2, 4), (0, 0), (1, – 2), (2, – 4), (3, – 6) in the coordinate plane on a graph paper as shown in Fig. 2.7. Join the points (– 3, 6) and (3, – 6) using a ruler. Doing so, observe that all five points lie on a straight line. Can you guess the equation of this line by looking at the relationship between the x and y coordinates of each point? Let’s join the points Looking at the relationship between each x and y. For every point, the y-value is exactly –2 times the x-value (eg: –2 × 2 = –4) Therefore, the equation is y = –2x
