


Solving Pair of Linear Inequalities
Solving Pair of Linear Inequalities
Last updated at Dec. 16, 2024 by Teachoo
Transcript
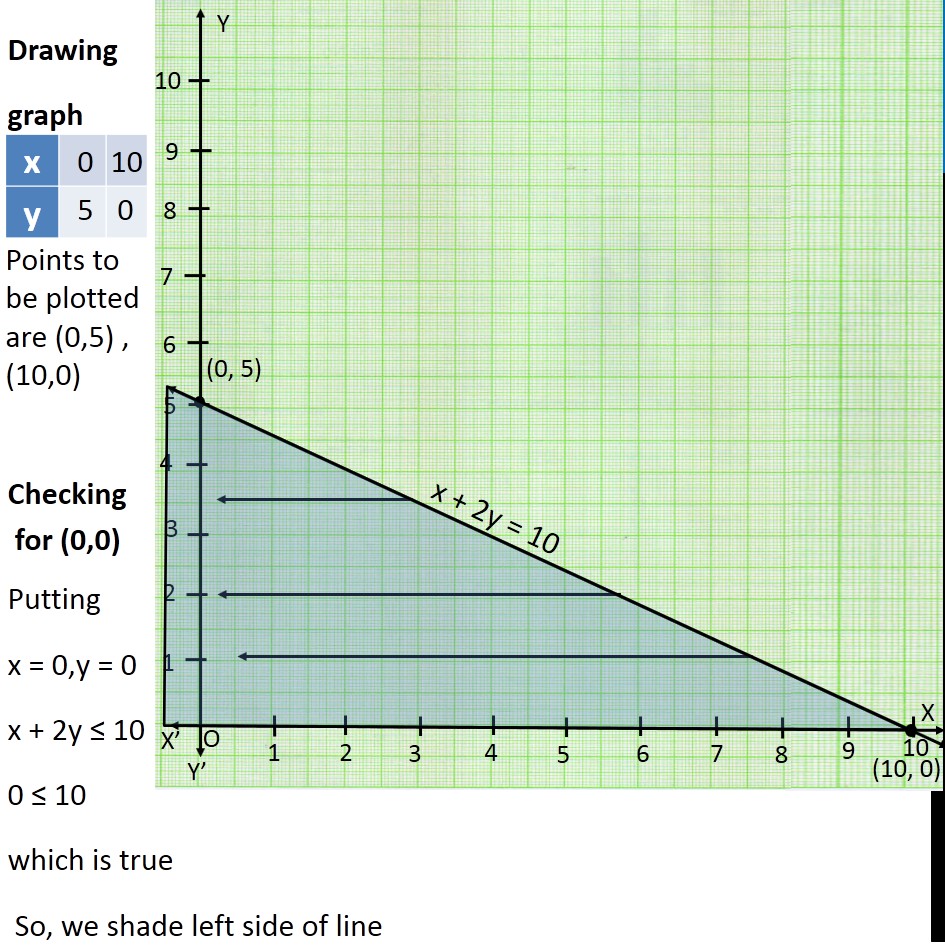
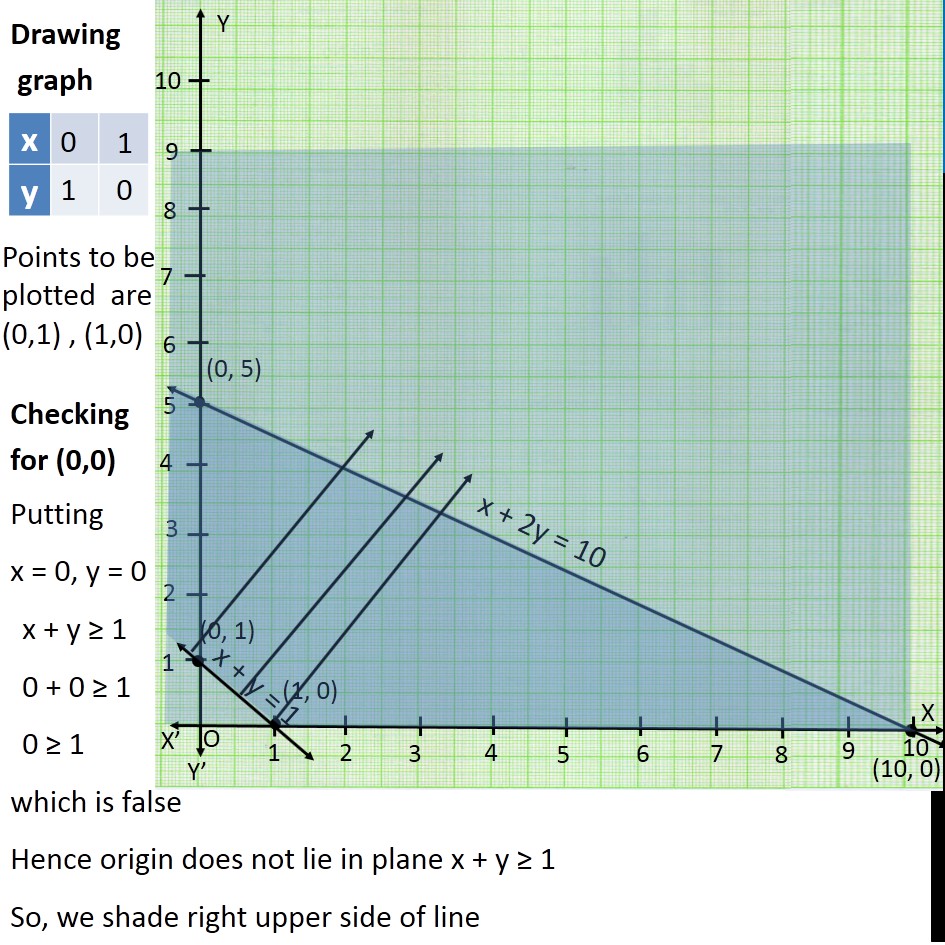
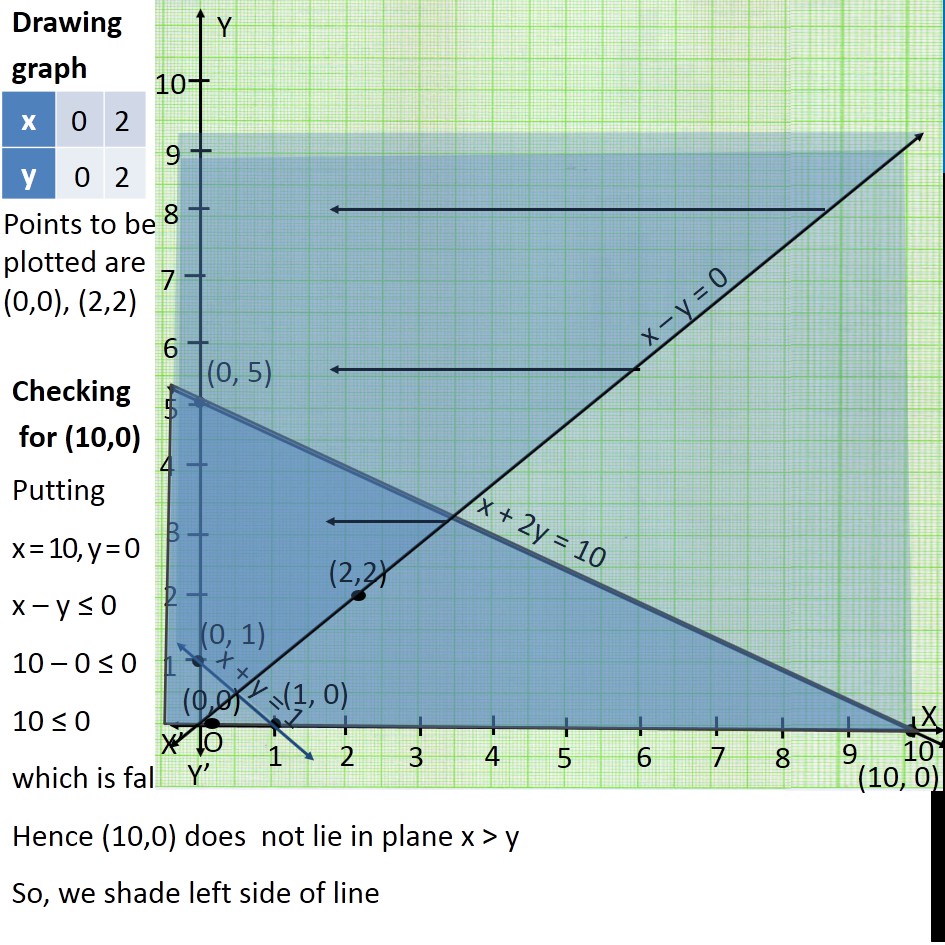
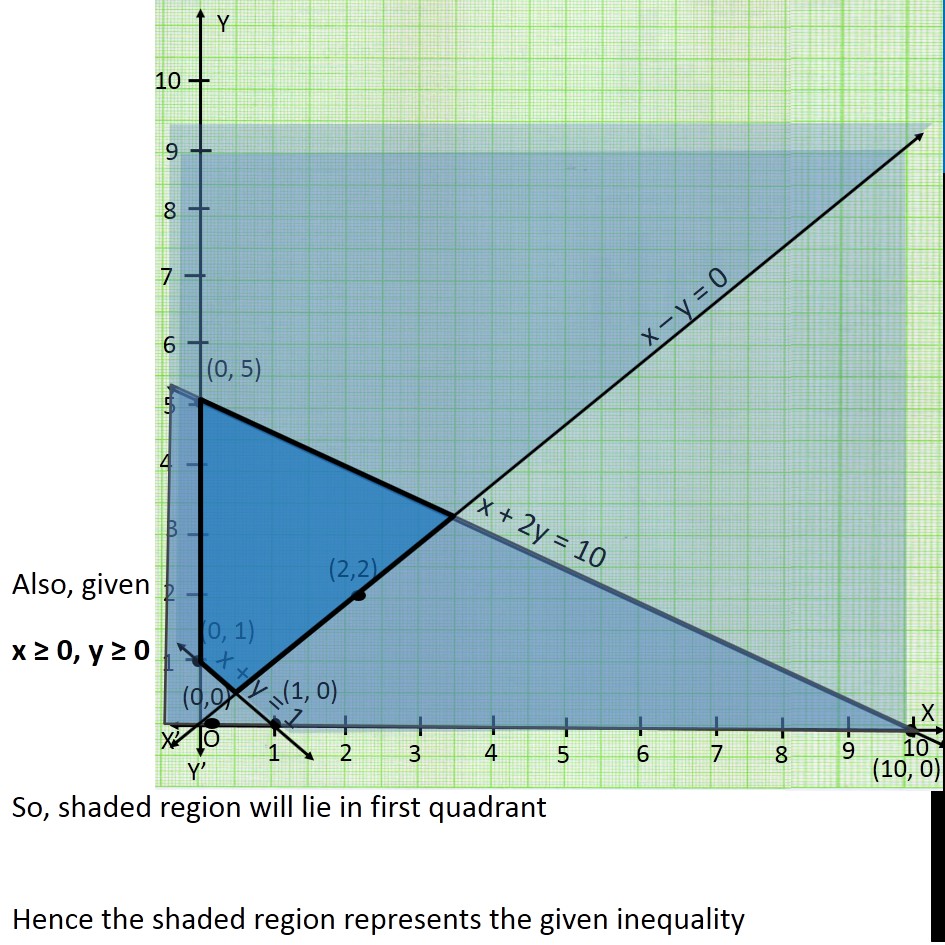
Question 15 Solve the following system of inequalities graphically: x + 2y ≤ 10, x + y ≥ 1, x – y ≤ 0, x ≥ 0, y ≥ 0 First we solve x + 2y ≤ 10 Lets first draw graph of x + 2y = 10 …(1) Putting x = 0 in (1) 0 + 2y = 10 2y = 10 y = 10/2 y = 5Putting y = 0 in (1) x + 2(0) = 10 x + 0 = 10 x = 10 Points to be plotted are (0,5) , (10,0) Now we solve x + y ≥ 1 Lets first draw graph of x + y = 1 Putting y = 0 in (1) x + 0 = 1 x = 1 Putting x = 0 in (1) 0 + y = 1 y = 1 Points to be plotted are (0,1) , (1,0) Drawing graph Checking for (0,0) Putting x = 0, y = 0 x + y ≥ 1 0 + 0 ≥ 1 0 ≥ 1 which is false Hence origin does not lie in plane x + y ≥ 1 So, we shade right upper side of line Now we solve x – y ≤ 0 Lets first draw graph of x – y = 0 Putting x = 0 in (3) 0 – y = 0 −y = 0 y = 0 Putting y = 2 in (2) x – 2 = 0 x = 0 + 2 x = 2 Points to be plotted are (0,0), (2,2) Drawing graph Checking for (10,0) Putting x = 10, y = 0 x – y ≤ 0 10 – 0 ≤ 0 10 ≤ 0 which is false. Hence (10,0) does not lie in plane x > y So, we shade left side of line Also, given x ≥ 0, y ≥ 0 So, shaded region will lie in first quadrant Hence the shaded region represents the given inequality
