You are here
- We studied demand (buyers) and supply (sellers) separately.
- In a real market, both act at the same time. Buyers want a low price; sellers want a high price.
- So at which price does the market settle? Let's go back to the mango market, this time with all its buyers and sellers.
- Quantity demanded (Qd) at different prices - as price increases, quantity demanded decreases.
| Price | Quantity demanded (Qd) |
|---|---|
| Rs 40 | 38 kg |
| Rs 100 | 12 kg |
| Rs 150 | 8 kg |
- Quantity supplied (Qs) at different prices - as price increases, quantity supplied increases.
| Price | Quantity supplied (Qs) |
|---|---|
| Rs 40 | 6 kg |
| Rs 100 | 12 kg |
| Rs 150 | 43 kg |
Table 9.3: Both tables together
- Note: These figures are from the book's Table 9.3. They are separate from the earlier demand and supply tables, so they do not match them exactly.
| Price | Quantity demanded (Qd) | Quantity supplied (Qs) | Outcome |
|---|---|---|---|
| Rs 40 | 38 kg | 6 kg | Qs < Qd: excess demand |
| Rs 100 | 12 kg | 12 kg | Qs = Qd: market equilibrium |
| Rs 150 | 8 kg | 43 kg | Qs > Qd: excess supply |
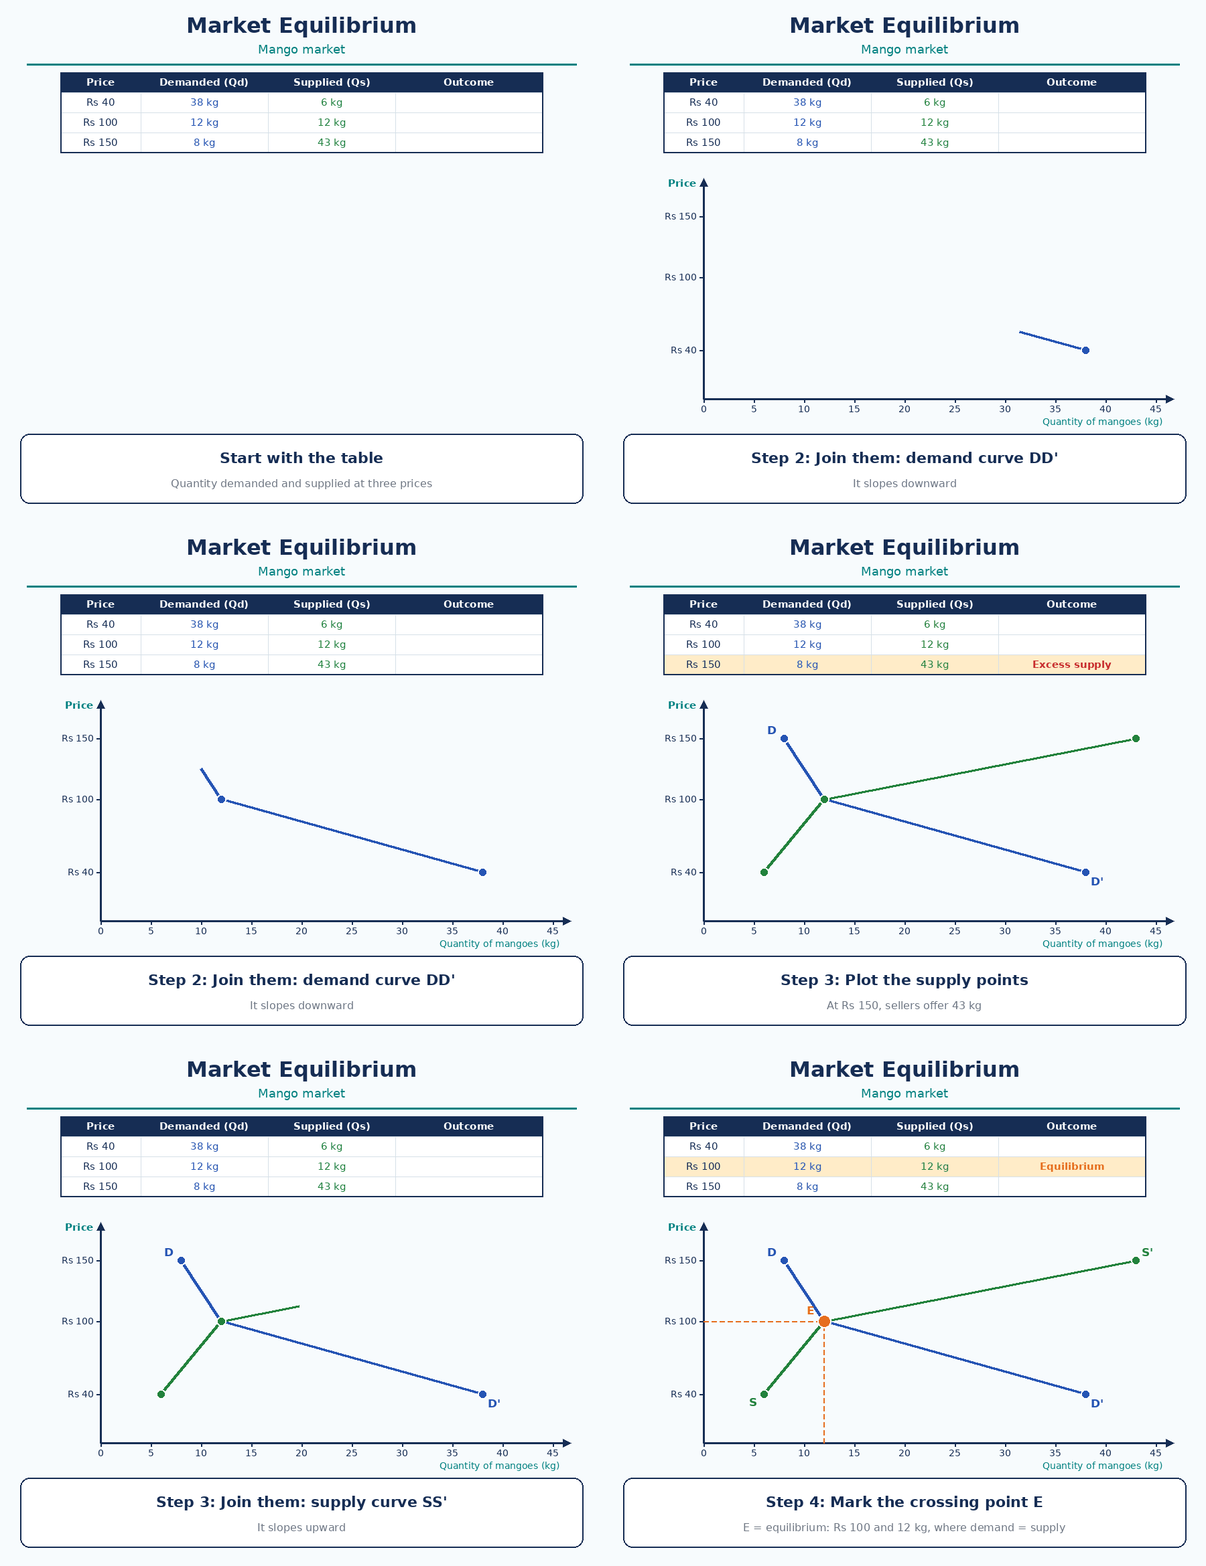
- At Rs 100 , quantity demanded and quantity supplied are equal (12 kg). This is called the equilibrium point (or market equilibrium ).
- It is the point where the supply of goods and services equals demand: quantity supplied = quantity demanded .
- In the mango example, the equilibrium point is at Rs 100 and 12 kg . Equilibrium price = Rs 100. Equilibrium quantity = 12 kg.
- On the x-axis , we show quantity (kg). On the y-axis , we show price (Rs).
- Plot the demand points and join them - this gives the demand curve DD', which slopes downward.
- Plot the supply points and join them - this gives the supply curve SS', which slopes upward.
- The point where the two lines cross is the equilibrium point E (Rs 100, 12 kg).
- Suppose the price is Rs 150 , above the equilibrium price. Sellers offer 43 kg, but buyers want only 8 kg. 35 kg of mangoes are left unsold.
- Supply is more than demand. This is called excess supply , or a surplus .
- To sell the unsold mangoes, sellers cut prices. The price falls towards E.
- Suppose the price is Rs 40 , below the equilibrium price. Buyers want 38 kg, but sellers offer only 6 kg. There is a shortfall of 32 kg.
- Demand is more than supply. This is called excess demand , or a shortage .
- Buyers compete for the few mangoes. The price rises towards E.
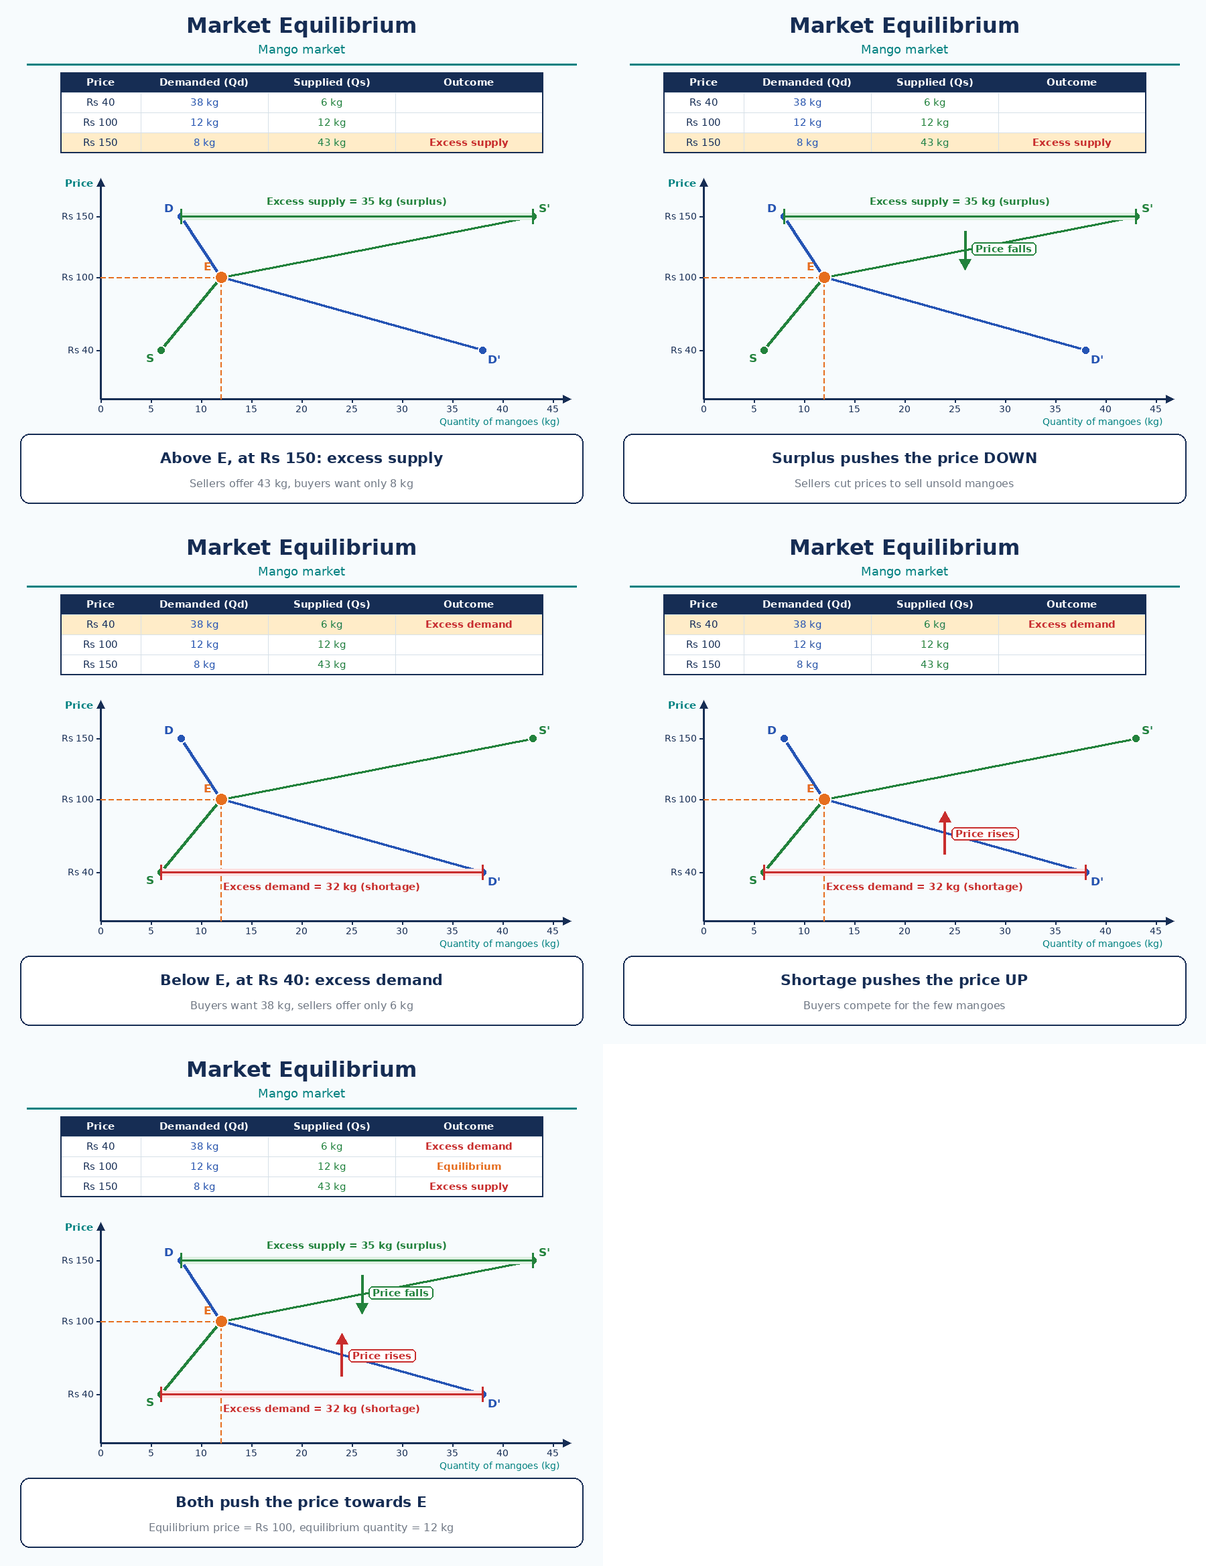
- Market equilibrium is another name for the equilibrium point - the point where supply of goods and services equals demand , meaning there is no excess supply (surplus) or excess demand (shortage) in the market, and prices tend to remain stable unless external factors change.
- In simple words - quantity supplied = quantity demanded; there is no surplus and no shortage; the price stays steady unless something outside the market changes; there is no pressure for the price to rise or fall; the market is cleared - everything brought to the market is sold.
- Prices are decided by the interaction between demand and supply , like a negotiation between what buyers will pay and what sellers will accept.
Using data from Table 9.3, plot the demand and supply curve at the three prices, i.e., Rs 40, Rs 100, and Rs 150. Identify and mark excess demand and supply on the graph. Think about how equilibrium could be reached in these scenarios.
- The two GIFs above draw this graph and mark both gaps. The curves meet at E (12 kg, Rs 100).
| Price | Gap | Marked as |
|---|---|---|
| Rs 40 | 38 - 6 = 32 kg | Excess demand (shortage) |
| Rs 150 | 43 - 8 = 35 kg | Excess supply (surplus) |
- At Rs 40, the shortage pushes the price up. At Rs 150, the surplus pushes the price down. Both move the price towards Rs 100.
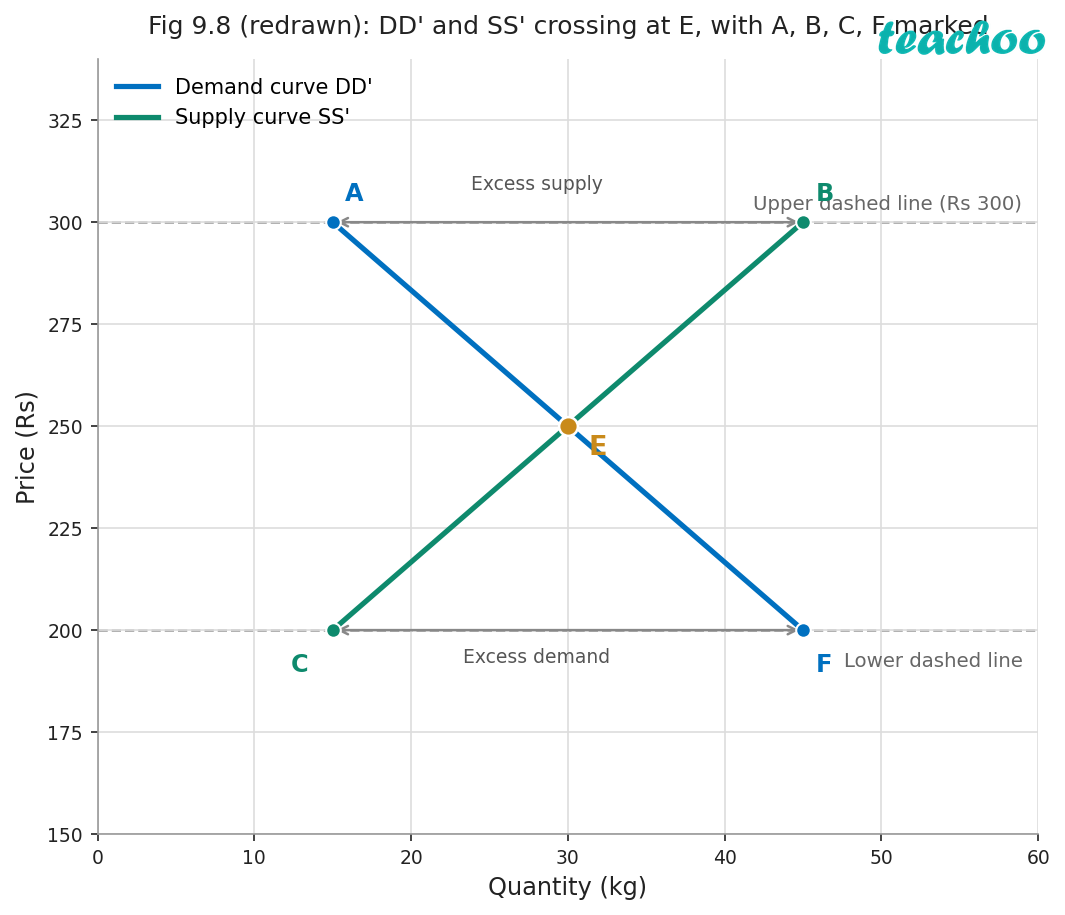
11. Fig. 9.8 shows the demand curve DD' and Supply curve SS'. a. What does point E represent in this market? b. What is the equilibrium price and equilibrium quantity at point E? c. Point A lies on DD'. Point B lies on SS'. What do the points A and B indicate about demand and supply? What does the gap between A and B (both on the upper dashed price line) represent? d. Point F lies on DD'. Point C lies on SS'. What do the points F and C indicate about demand and supply? What does the gap between C and F (both on the lower dashed price line) represent? e. If the price stays at the lower dashed line, what could happen next in a free market?
| Price line | Demand point | Supply point | Gap |
|---|---|---|---|
| Upper dashed line (Rs 300) | A | B | Excess supply (surplus) |
| Equilibrium (E) | 30 kg at about Rs 250 | No gap | |
| Lower dashed line | F | C | Excess demand (shortage) |
- a. E is the market equilibrium , the point where the demand curve and the supply curve cross. Demand equals supply there.
- b. The figure does not print E's values. Reading the graph: equilibrium quantity is 30 kg , and equilibrium price is about Rs 250 , halfway between Rs 200 and Rs 300.
- c. On the upper dashed line (Rs 300), above E: A shows the quantity demanded, B shows the quantity supplied. B is further right than A, so supply is more than demand. The gap between A and B is excess supply (surplus) .
- d. On the lower dashed line, below E: F shows the quantity demanded, C shows the quantity supplied. F is further right than C, so demand is more than supply. The gap between C and F is excess demand (shortage) .
- e. At the lower price there is a shortage. Buyers compete for the limited goods, so the price rises. It keeps rising until it reaches E, where the shortage disappears.
12. Draw a market equilibrium graph using the following demand schedule.
| Price (Rs) | 10 | 20 | 30 | 40 | 50 |
|---|---|---|---|---|---|
| Q.D. (kg) | 5 | 10 | 15 | 20 | 25 |
| Q.S. (kg) | 25 | 20 | 15 | 10 | 5 |
a. Plot the demand and supply curve using the above data. b. Identify the equilibrium price and quantity. c. Observe the above data and analyse what happens if the price is set at Rs 20 or Rs 40.
| Price (Rs) | 10 | 20 | 30 | 40 | 50 |
|---|---|---|---|---|---|
| Q.D. (kg) | 5 | 10 | 15 | 20 | 25 |
| Q.S. (kg) | 25 | 20 | 15 | 10 | 5 |
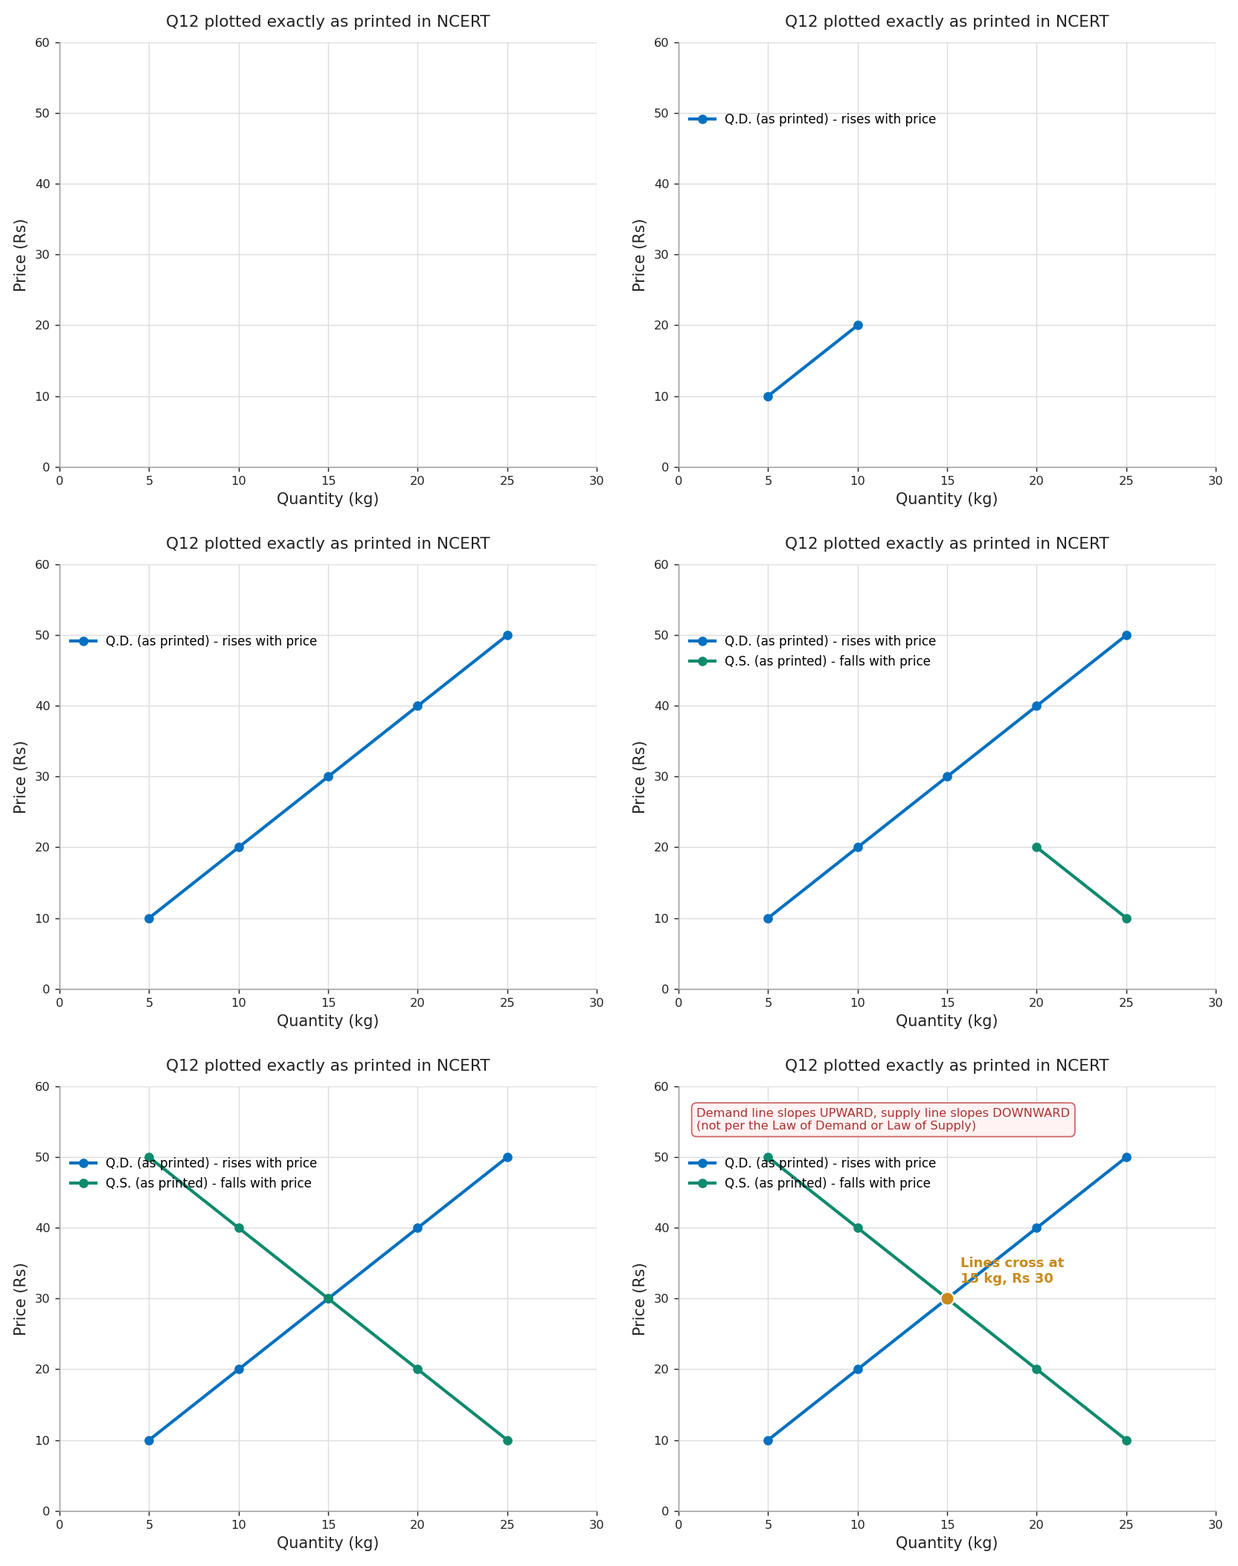
- a. Plot price on the y-axis and quantity on the x-axis. Join the Q.D. points to get the demand line, and join the Q.S. points to get the supply line.
- b. The two lines cross where Q.D. = Q.S. = 15 kg. Equilibrium price = Rs 30, Equilibrium quantity = 15 kg.
| Price | Q.D. | Q.S. | Result |
|---|---|---|---|
| Rs 20 | 10 kg | 20 kg | Excess supply of 10 kg |
| Rs 40 | 20 kg | 10 kg | Excess demand of 10 kg |
Note on the printed data
- In the printed table, quantity demanded rises as price rises, and quantity supplied falls as price rises.
- This is inconsistent with the Law of Demand and the Law of Supply taught earlier in this chapter.
- So the printed demand line slopes upward and the supply line slopes downward.
Possible correction (explanatory version, not NCERT): if the two rows were swapped, the data would follow both laws:
| Price | Rs 10 | Rs 20 | Rs 30 | Rs 40 | Rs 50 |
|---|---|---|---|---|---|
| Quantity demanded (kg) | 25 | 20 | 15 | 10 | 5 |
| Quantity supplied (kg) | 5 | 10 | 15 | 20 | 25 |
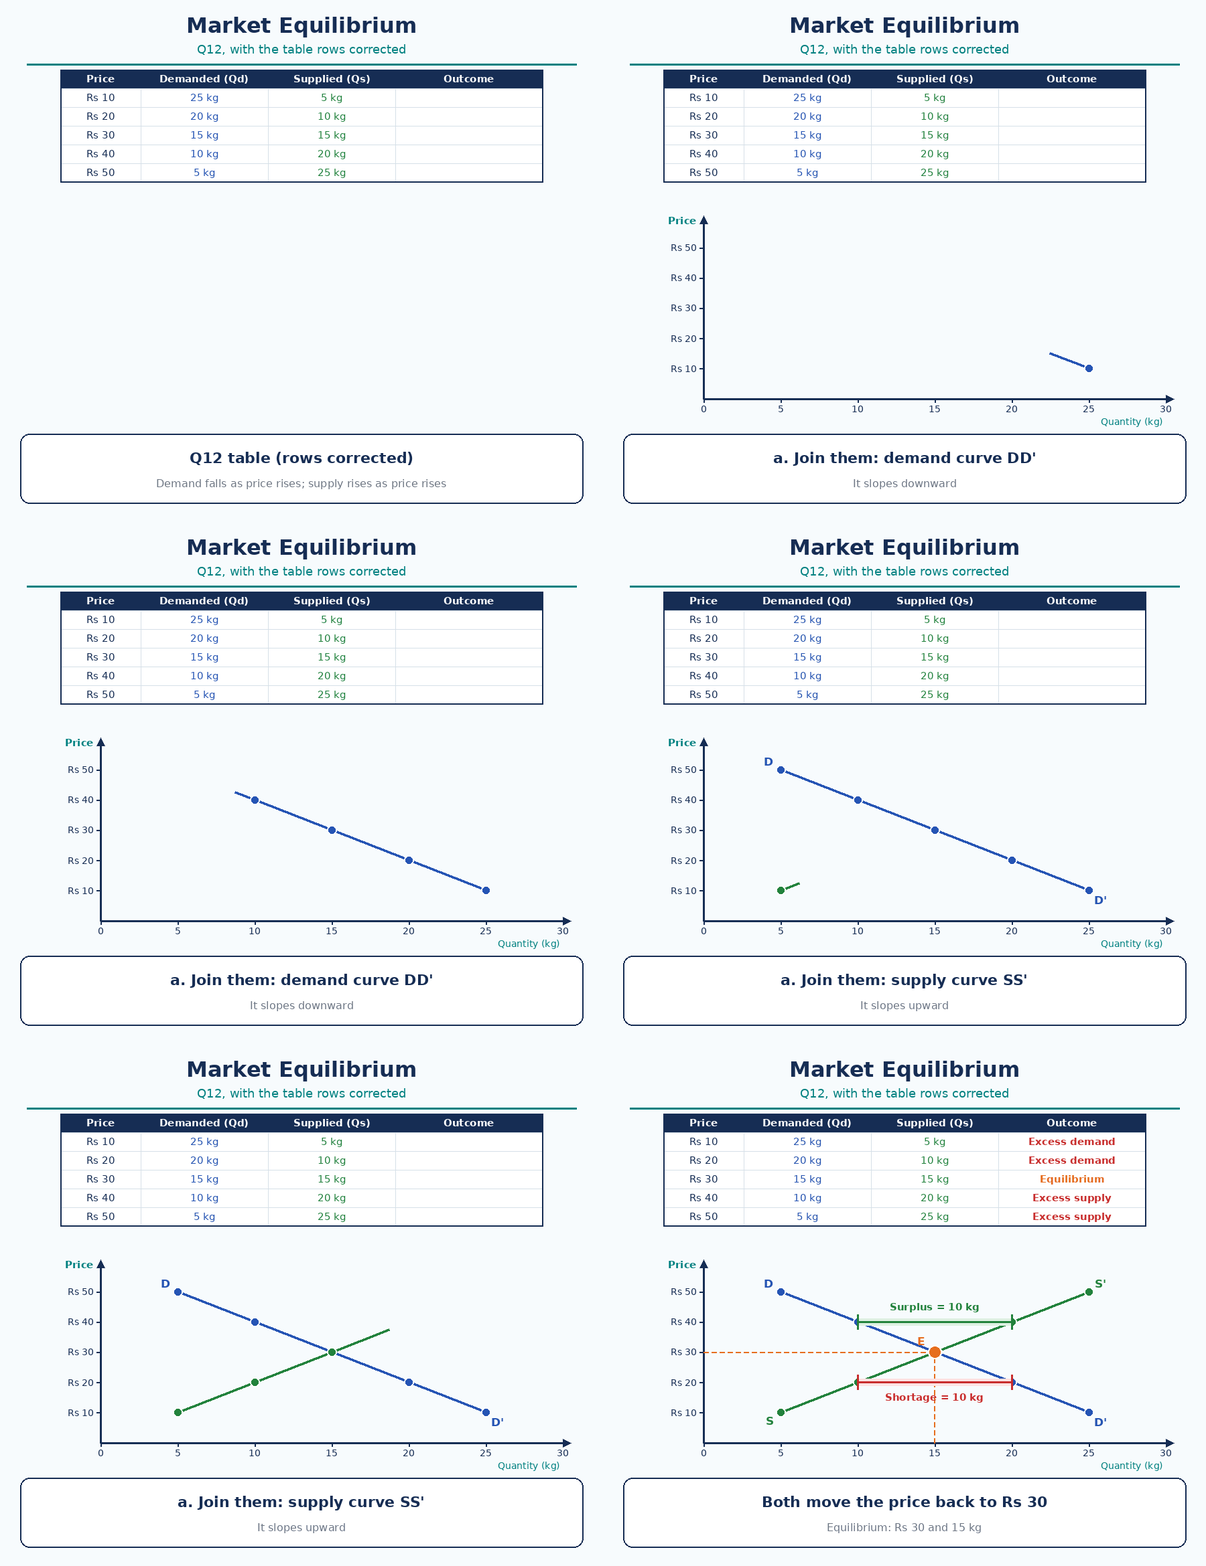
- The equilibrium is still Rs 30 and 15 kg. In this version, the demand curve slopes downward and the supply curve slopes upward, as the Law of Demand and the Law of Supply predict.
| Price | Demand | Supply | Result | What happens next |
|---|---|---|---|---|
| Rs 20 | 20 kg | 10 kg | Shortage of 10 kg | Price rises towards Rs 30 |
| Rs 40 | 10 kg | 20 kg | Surplus of 10 kg | Price falls towards Rs 30 |
Show answer
The point where quantity demanded equals quantity supplied, so there is no shortage or surplus.
Show answer
Excess demand (shortage) means demand is more than supply. Excess supply (surplus) means supply is more than demand.
Show answer
Cleared.
Show answer
Rs 100 and 12 kg.
Show answer
False. Above equilibrium, supply is more than demand, so there is a surplus.
- The equilibrium point (market equilibrium) is where quantity demanded equals quantity supplied: Rs 100 and 12 kg in the mango example.
- Above the equilibrium price there is excess supply (surplus), and below it excess demand (shortage).
- A surplus pushes the price down and a shortage pushes it up, so the price moves towards equilibrium.