You are here
- In the flight example, we saw that a price depends on two things: demand and supply .
- Let's start with demand , the buyer's side of the market.
- We will follow one buyer, Srivalli , who buys mangoes from her local market.
- Let's see how much she buys when the price of mangoes changes.
- At the beginning of the mango season, the price of mangoes is high.
- Later, in the peak season, the price falls.
- The quantity Srivalli buys at different prices is:
| Price of mango per kg | Quantity demanded by Srivalli |
|---|---|
| Rs 150 | 1 kg |
| Rs 100 | 2 kg |
| Rs 50 | 3 kg |
- As the price falls, Srivalli buys more mangoes.
- Wanting something is not enough to buy it.
- Srivalli wants to buy an iPhone, but she cannot afford it. She does not have the money.
- If the price of the iPhone rises or falls, the quantity she buys stays 0.
- Now take the opposite case.
- Mr M is very rich. He can afford an iPhone, but he prefers an Android phone.
- If the price of the iPhone rises or falls, the quantity he buys stays 0.
- The quantity of a product that people are willing and able to buy at a particular price, depending on their needs, preferences, season, trend, and income, is called the demand for the product.
- Willing to pay - you want the product and are ready to spend money on it.
- Able to pay - you actually have enough money to buy it. This is called purchasing power : how much one unit of a currency can buy at a particular time.
-
Demand exists only when
both
are there.
- Srivalli and mangoes: willing and able. So there is demand.
- Srivalli and the iPhone: willing but not able. So there is no demand.
- Mr M and the iPhone: able but not willing. So there is no demand.
| Case | Willing? | Able? | Demand? |
|---|---|---|---|
| Srivalli and mangoes | Yes | Yes | Yes |
| Srivalli and the iPhone | Yes | No | No |
| Mr M and the iPhone | No | Yes | No |
Wants the product
Has the purchasing power
- When price falls, quantity demanded rises. When price rises, quantity demanded falls.
- This means price and quantity demanded have an inverse relationship - they move in opposite directions.
- This inverse relationship between the price of a product and its quantity demanded is called the Law of Demand .
- Demand schedule - a table showing the quantity demanded at different prices.
| Price of mango per kg | Quantity demanded by Srivalli | Point |
|---|---|---|
| Rs 150 | 1 kg | A |
| Rs 100 | 2 kg | B |
| Rs 50 | 3 kg | C |
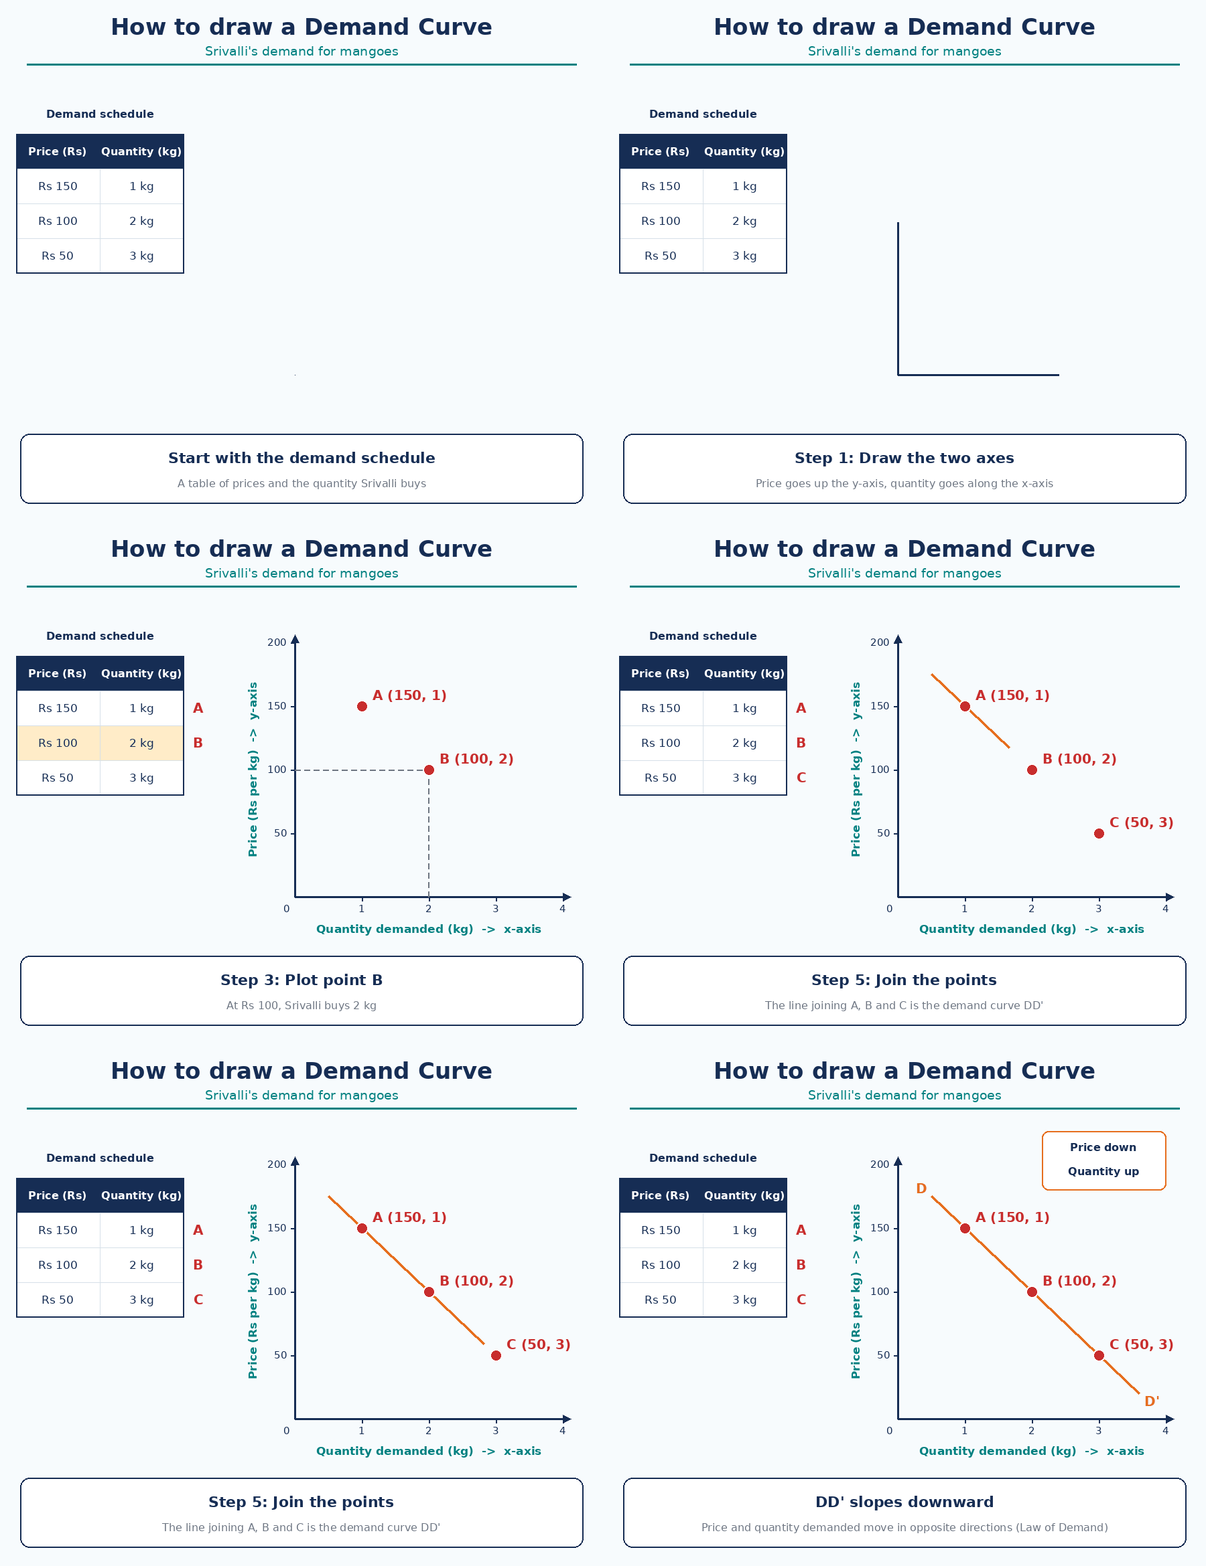
- Demand curve - the demand schedule drawn as a graph.
-
How to draw it:
- Draw two axes. Price goes on the y-axis, quantity on the x-axis.
- Plot point A at (Rs 150, 1 kg).
- Plot point B at (Rs 100, 2 kg).
- Plot point C at (Rs 50, 3 kg).
- Join the points. The line is the demand curve DD'.
- DD' slopes downward. This shows the inverse relationship between price and quantity.
- The quantity of a good or service that an individual consumer wants to buy at different prices, keeping other factors constant , is called individual demand .
- "Other factors constant" means things like income and taste do not change. Only the price changes.
- Srivalli's mango table shows her individual demand.
- The total quantity demanded by all potential buyers at different prices, that is, the sum of all individual demand , is called market demand .
| Price | Q1 (Srivalli) | Q2 (Alex) | Q3 (Israt) | Market demand (QD) |
|---|---|---|---|---|
| Rs 150 | 1 kg | 2 kg | 3 kg | 6 kg |
| Rs 100 | 2 kg | 4 kg | 6 kg | 12 kg |
| Rs 50 | 3 kg | 6 kg | 9 kg | 18 kg |
- QD = Q1 + Q2 + Q3.
- Plotting market demand at each price gives the market demand curve DmDm'.
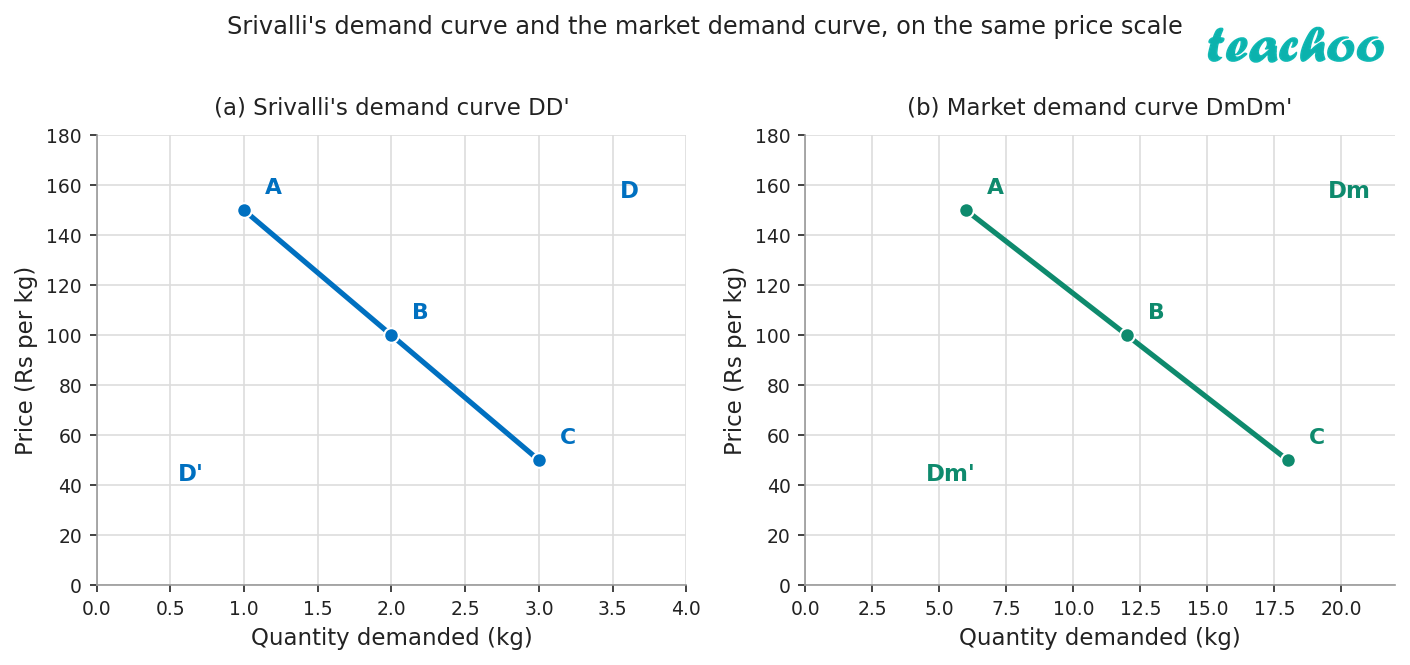
Question: Did you notice that the market demand curve is flatter than Srivalli's individual demand curve? Why is that?
- Market demand adds up many buyers.
- When the price falls from Rs 150 to Rs 50: Srivalli's demand rises by 2 kg, but market demand rises by 12 kg.
- The same price change causes a much bigger change in quantity.
- So the market curve is flatter and more responsive.
8. In the table below, different prices of guava are given. a. Think and write how much guava you will buy at each price. b. Ask the same question to three of your friends and fill in the table. c. Also make a graph for each one of you and one final graph for the total quantity.
Sample answer (your numbers will differ):
| Price | You | Friend 1 | Friend 2 | Friend 3 | Total |
|---|---|---|---|---|---|
| Rs 100/kg | 1 kg | 0 kg | 0 kg | 0 kg | 1 kg |
| Rs 80/kg | 2 kg | 1 kg | 1 kg | 1 kg | 5 kg |
| Rs 50/kg | 3 kg | 2 kg | 2 kg | 3 kg | 10 kg |
| Rs 20/kg | 5 kg | 4 kg | 3 kg | 4 kg | 16 kg |
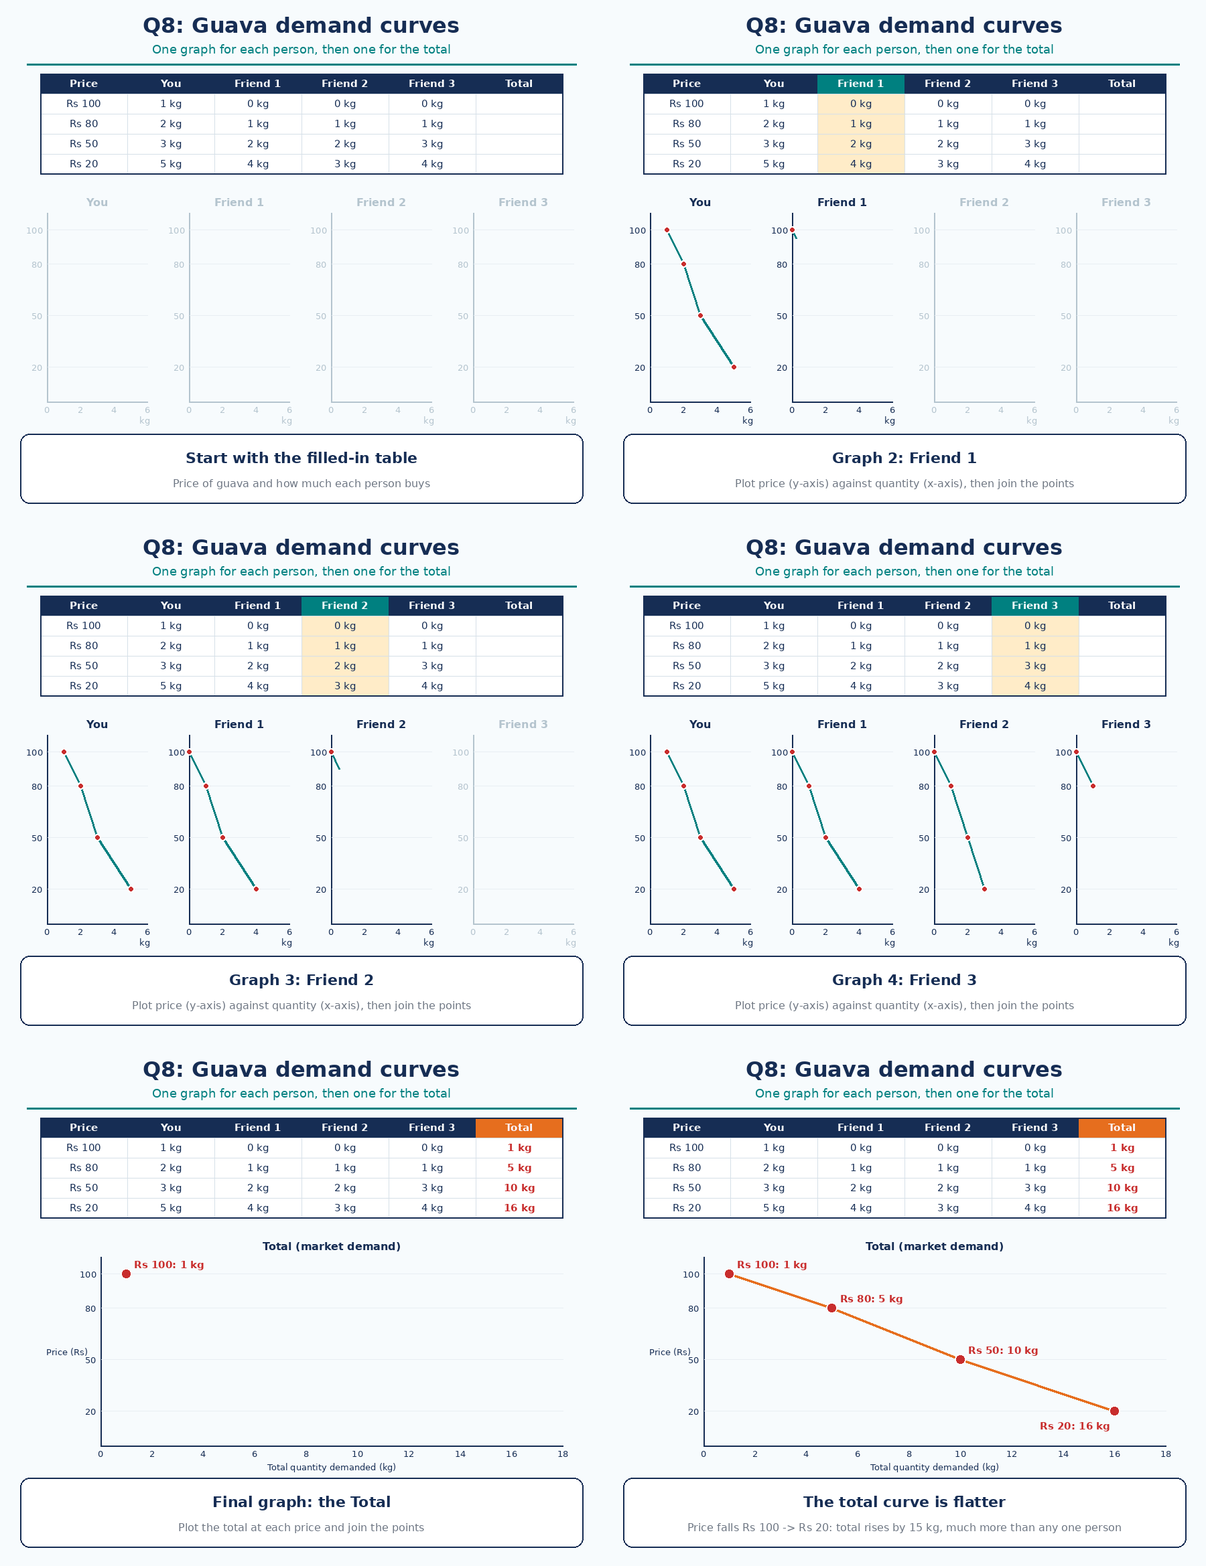
- Price is on the y-axis and quantity on the x-axis.
- Each person's graph slopes downward.
- The total graph is the market demand curve. It is flatter, because the total rises by 15 kg as the price falls from Rs 100 to Rs 20.
Show answer
The quantity of a product that people are willing and able to buy at a particular price.
Show answer
No. He is able but not willing to pay.
Show answer
Inverse.
Show answer
Individual demand is one buyer's demand. Market demand is the sum of all buyers' demand.
Show answer
12 kg.
- Demand needs both willingness and ability to pay.
- By the Law of Demand, price and quantity demanded move in opposite directions, so the demand curve slopes downward.
- Market demand is the sum of all individual demand, and in this example its curve is flatter.