You are here
Now, the other side of the market
- So far, we looked at buyers like Srivalli. That was demand.
- But mangoes reach the market only because someone sells them. This is the seller's side, called supply .
- Let's go back to the same mango market and look at one seller, Seller A .
- Let's see how much he offers for sale when the price of mangoes changes.
Example 1: How much does a seller offer at different prices?
- The quantity Seller A offers for sale at different prices is:
| Price of mango per kg | Quantity supplied by Seller A |
|---|---|
| Rs 50 | 1 kg |
| Rs 100 | 2 kg |
| Rs 150 | 3 kg |
- As the price rises, the seller offers more mangoes.
Example 2: What if a seller wants to sell but does not have enough?
- A small shopkeeper sees a good price and wants to sell 100 kg of mangoes.
- But he has only 10 kg. He is willing, but not able, to sell 100 kg.
Example 3: What if a seller has mangoes but the price is too low?
- A farmer has plenty of mangoes. But the market price is so low that he would make a loss.
- So he does not send them to the market. He makes pickle at home instead. He is able, but not willing, to sell.
So what is supply?
- Supply is the quantity of a product that sellers are willing and able to offer at a particular price.
What do "willing to sell" and "able to sell" mean?
- Willing to sell - the seller wants to sell at that price.
- Able to sell - the seller actually has that much to sell.
- Supply exists only when both are there.
| Case | Willing? | Able? | Supply? |
|---|---|---|---|
| Seller A at Rs 150 | Yes | Yes | Yes |
| Shopkeeper wanting to sell 100 kg | Yes | No | No |
| Farmer at a loss-making price | No | Yes | No |
What is the Law of Supply?
- When price rises, quantity supplied rises. When price falls, quantity supplied falls.
- Price and quantity supplied move in the same direction. This is known as the Law of Supply .
- Why does this happen? Higher prices mean more profit. More profit encourages producers to make more, and higher prices also attract new firms to the market.
The Law of Supply
Price rises
↑
Quantity supplied rises
↑
Price falls
↓
Quantity supplied falls
↓
↓
Price and quantity supplied move in the same direction
What are a supply schedule and a supply curve?
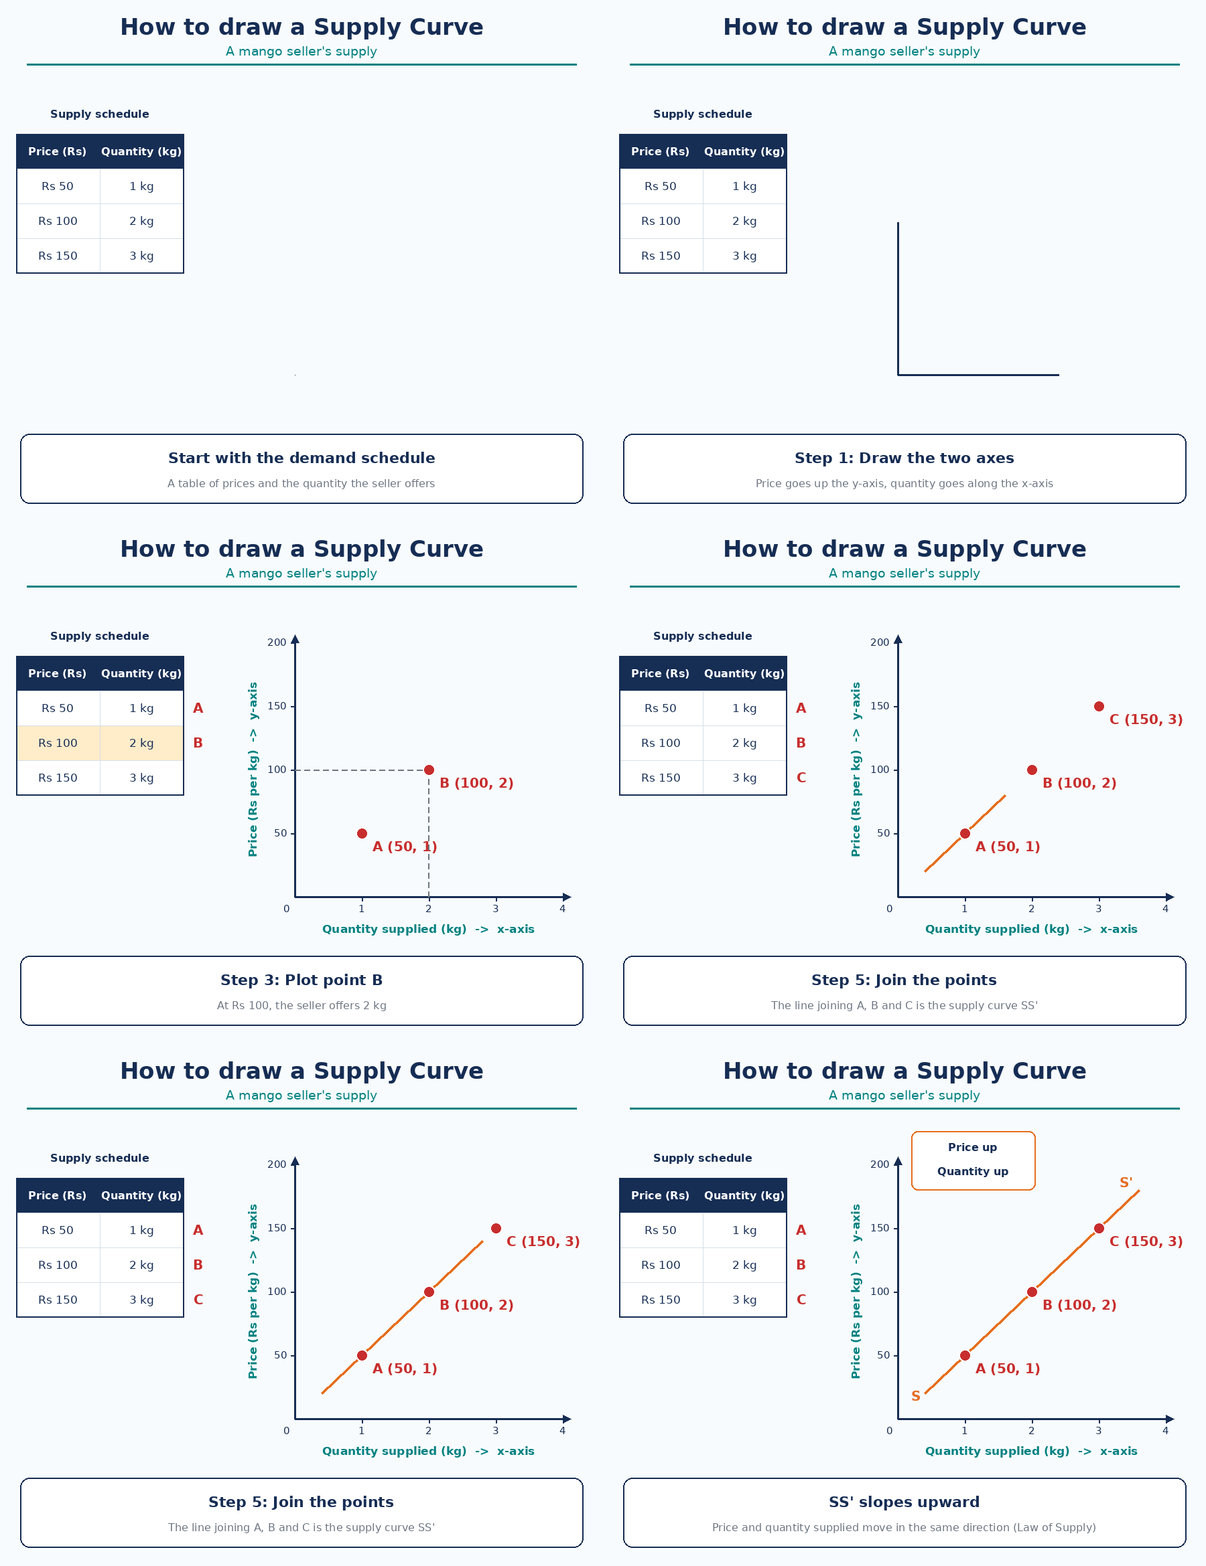
- Supply schedule - a table showing the quantity supplied at different prices.
| Price of mango per kg | Quantity supplied by Seller A | Point |
|---|---|---|
| Rs 50 | 1 kg | A |
| Rs 100 | 2 kg | B |
| Rs 150 | 3 kg | C |
- Supply curve - the supply schedule drawn as a graph.
-
How to draw it:
- Draw two axes. Price goes on the y-axis, quantity on the x-axis.
- Plot point A at (Rs 50, 1 kg).
- Plot point B at (Rs 100, 2 kg).
- Plot point C at (Rs 150, 3 kg).
- Join the points. The line is the supply curve SS'.
- SS' slopes upward . This shows that price and quantity supplied move together.
Drawing a seller's supply curve step by step
What is individual supply?
- Individual supply is the quantity a particular seller offers at different prices. Seller A's table shows his individual supply.
What is market supply?
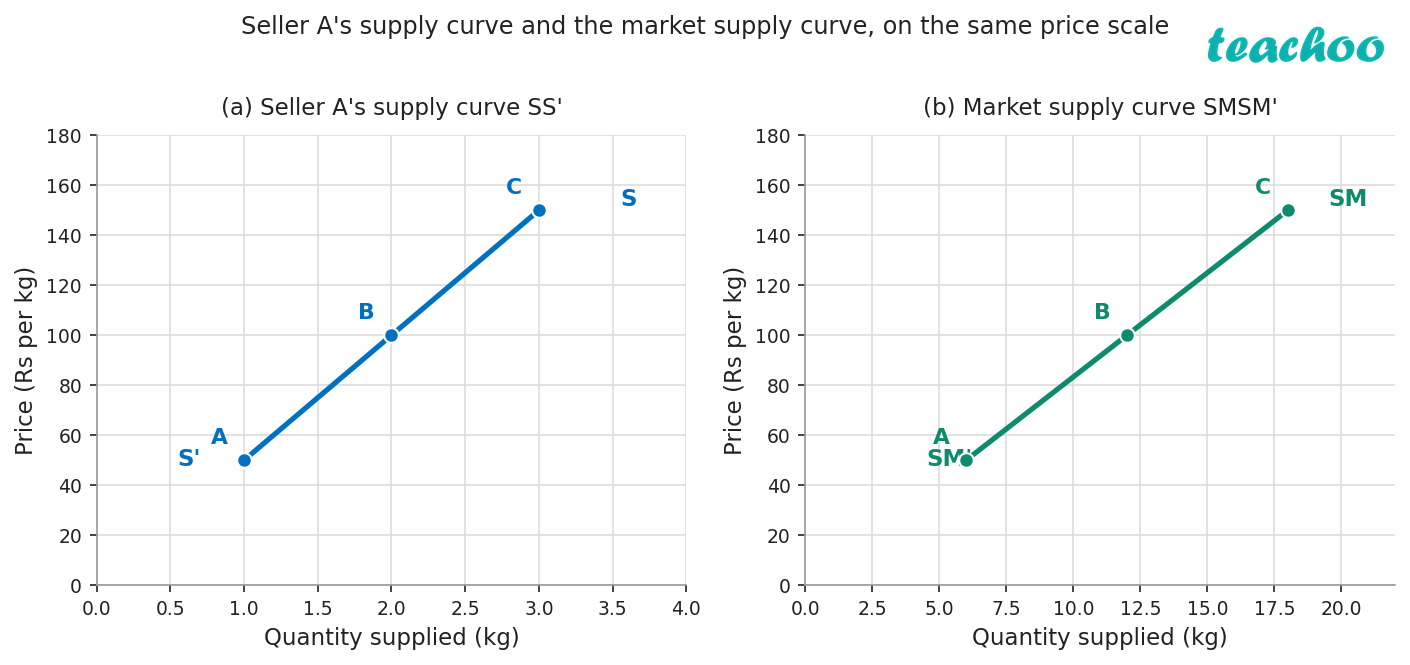
- Market supply is the sum of all individual supplies .
| Price | Seller A | Seller B | Seller C | Market supply (QS) |
|---|---|---|---|---|
| Rs 50 | 1 kg | 3 kg | 2 kg | 6 kg |
| Rs 100 | 2 kg | 4 kg | 6 kg | 12 kg |
| Rs 150 | 3 kg | 7 kg | 8 kg | 18 kg |
- QS = A + B + C. Plotting market supply at each price gives the market supply curve SMSM'.
Seller A's supply curve and the market supply curve, on the same price scale (Fig 9.5)
What is the difference between individual supply and market supply?
Individual supply
Market supply
One seller's supply
All sellers' supply added together
At Rs 100: Seller A offers 2 kg
At Rs 100: A + B + C = 12 kg
Curve SS'
Curve SMSM'
What is the difference between the Law of Demand and the Law of Supply?
Law of Demand
Law of Supply
Price and quantity move in opposite directions
Price and quantity move in the same direction
Curve slopes downward
Curve slopes upward
How do demand and supply together decide price?
- At the start of the mango season, supply is low, so mangoes are costly. In mid-season, supply increases, so prices fall.
| Situation | Price |
|---|---|
| Supply less than demand | Rises |
| Supply more than demand | Falls |
- This is what happened with the Goa flight ticket in the Introduction.
1. What is supply?
Show answer
The quantity of a product that sellers are willing and able to offer at a particular price.
2. A farmer has mangoes but will not sell them at a loss-making price. Is this supply?
Show answer
No. He is able but not willing to sell.
3. Fill in the blank: By the Law of Supply, price and quantity supplied move in the ______ direction.
Show answer
Same.
4. Give two reasons why sellers offer more at higher prices.
Show answer
Higher prices mean more profit, which encourages more output. They also attract new firms to the market.
5. At Rs 150, Sellers A, B and C offer 3 kg, 7 kg and 8 kg. What is the market supply?
Show answer
18 kg.
📝 What Have We Learned
- Supply is the quantity sellers are willing and able to offer at a price.
- By the Law of Supply, price and quantity supplied move in the same direction, so the supply curve slopes upward.
- Market supply is the sum of all individual supplies; when supply is less than demand prices rise, and when it is more, prices fall.