You are here
Question · Revise, Reflect, Refine, Q10, page 113
The acceleration-mass graph for the acceleration produced by a force on objects of different masses is plotted in Fig. 6.40. Plot the force-mass graph for this case.
![Question 10 — The acceleration-m - How Forces Affect Moti - [Teachoo] - Questions at the end of the chapter](https://cdn.teachoo.com/8ec1b940-8f76-4c77-bbb6-426f1f392e5c/animation-for-the-acceleration-mass-graph-for-the-acceleration-produced-by-a-force-on-objects-of-different-masses-is-pl.gif)
Show answer
Answer
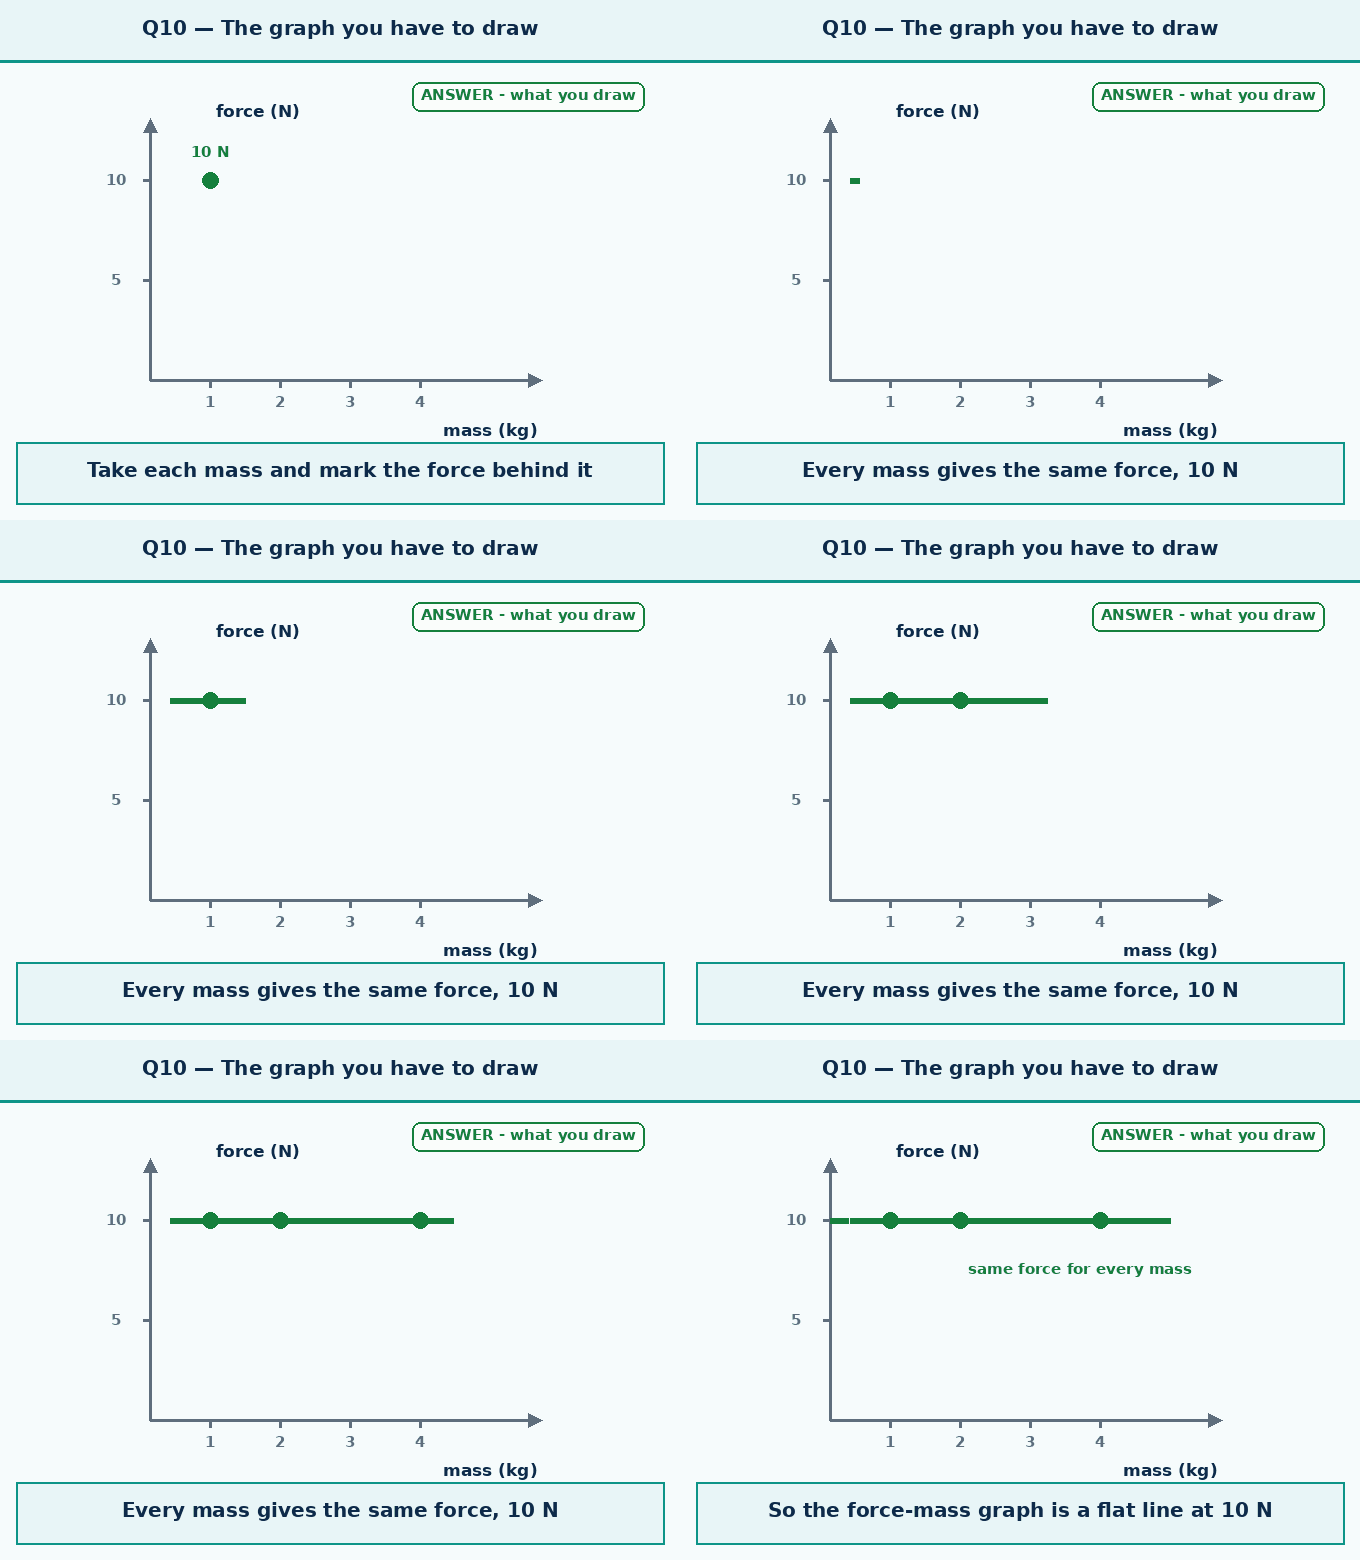
- Read one pair of values off the graph. At m = 1 kg the acceleration is 10.0 m s⁻².
- Force, F = ma = 1 kg × 10.0 m s⁻² = 10 N
- Check another point. At m = 4 kg the acceleration is 2.5 m s⁻².
- Force, F = ma = 4 kg × 2.5 m s⁻² = 10 N
- The force works out the same for every mass, so one and the same force of 10 N was applied throughout.
- Answer: The force-mass graph is a straight line parallel to the mass axis, at F = 10 N.