
Examples
![]()
![]()
![]()
![]()
![]()
![]()
![]()
![]()
![]()
![]()
![]()
![]()
![]()
![]()
![]()
![]()
![]()
![]()
![]()
![]()
Last updated at December 16, 2024 by Teachoo
Transcript
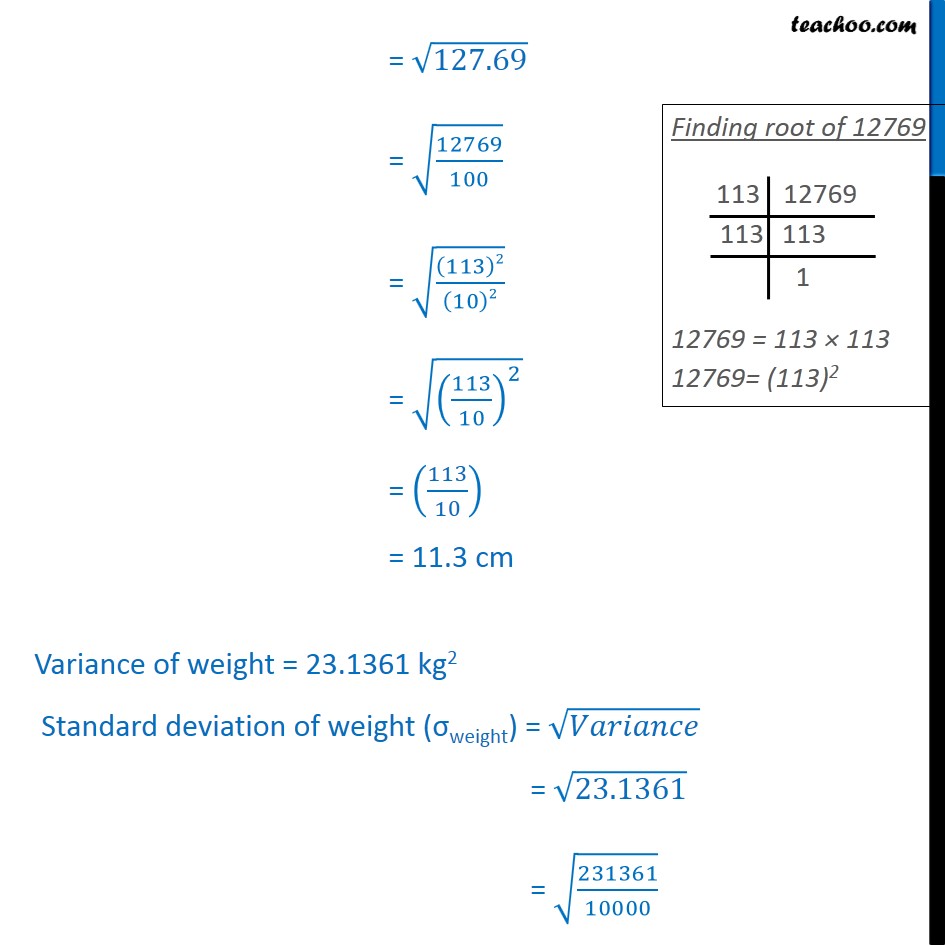
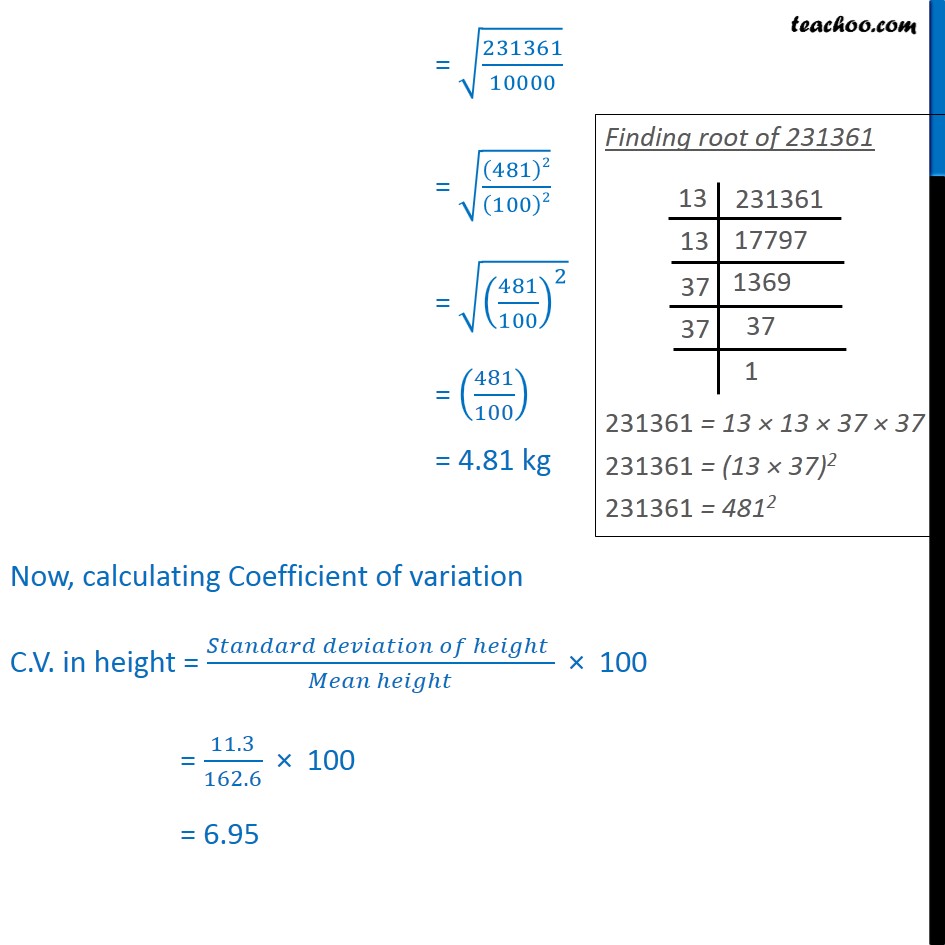
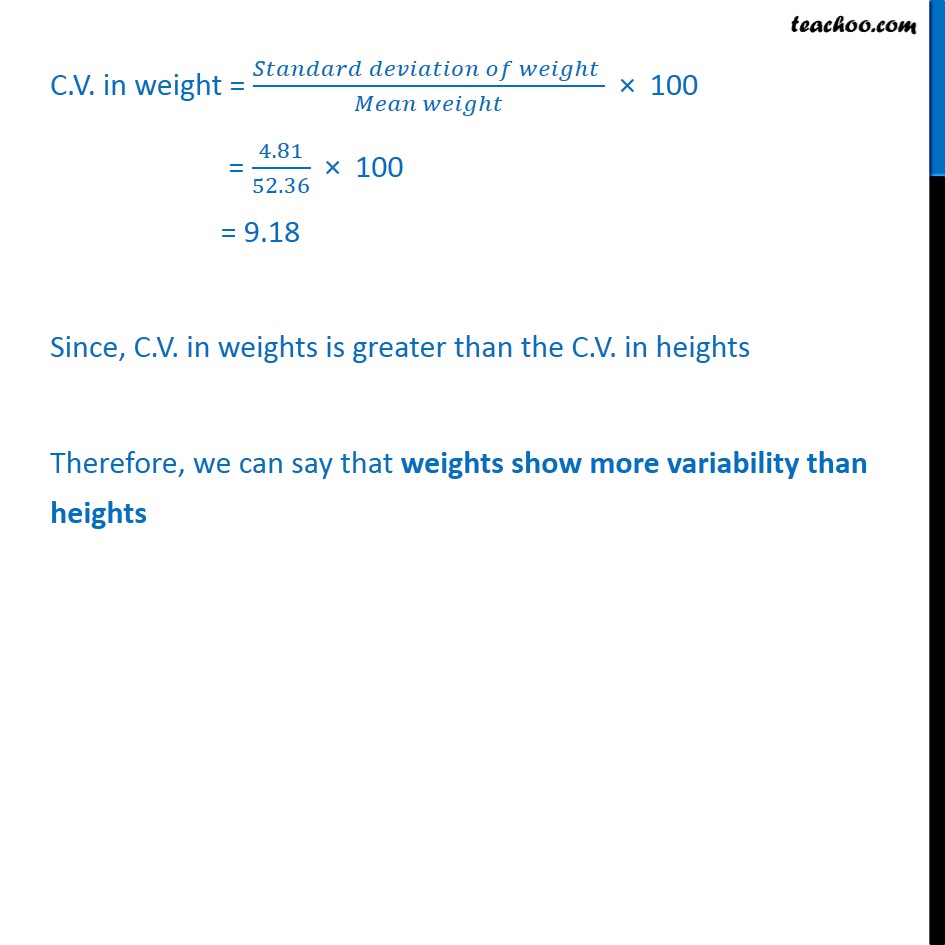
Question 3 The following values are calculated in respect of heights and weights of the students of a section of Class XI : Can we say that the weights show greater variation than the heights? To compare the variation, we have to calculate coefficient of variation Coefficient of variation(C.V.) = 100 Variance of height = 127.69 cm2 Standard deviation of height = = 127.69 = 127.69 = 12769 100 = 113 2 10 2 = 113 10 2 = 113 10 = 11.3 cm Variance of weight = 23.1361 kg2 Standard deviation of weight ( weight) = = 23.1361 = 231361 10000 = 231361 10000 = 481 2 100 2 = 481 100 2 = 481 100 = 4.81 kg Now, calculating Coefficient of variation C.V. in height = 100 = 11.3 162.6 100 = 6.95 C.V. in weight = 100 = 4.81 52.36 100 = 9.18 Since, C.V. in weights is greater than the C.V. in heights Therefore, we can say that weights show more variability than heights
