Last updated at May 6, 2026 by Teachoo
Transcript
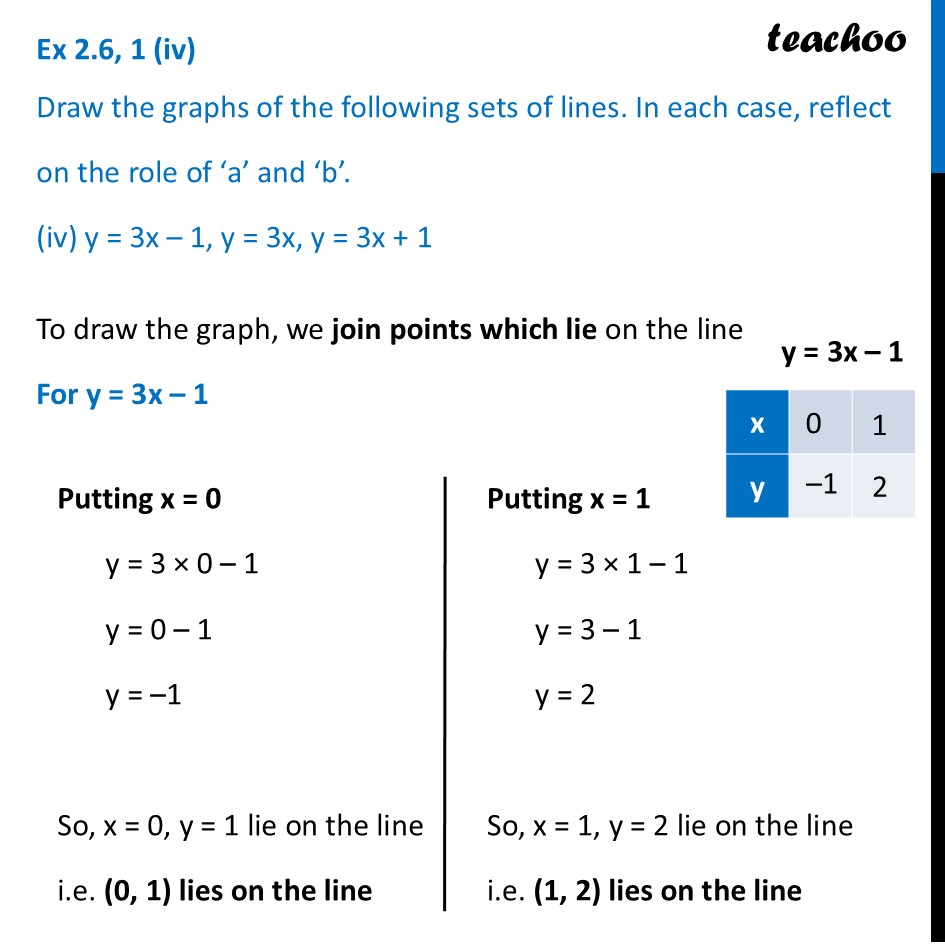
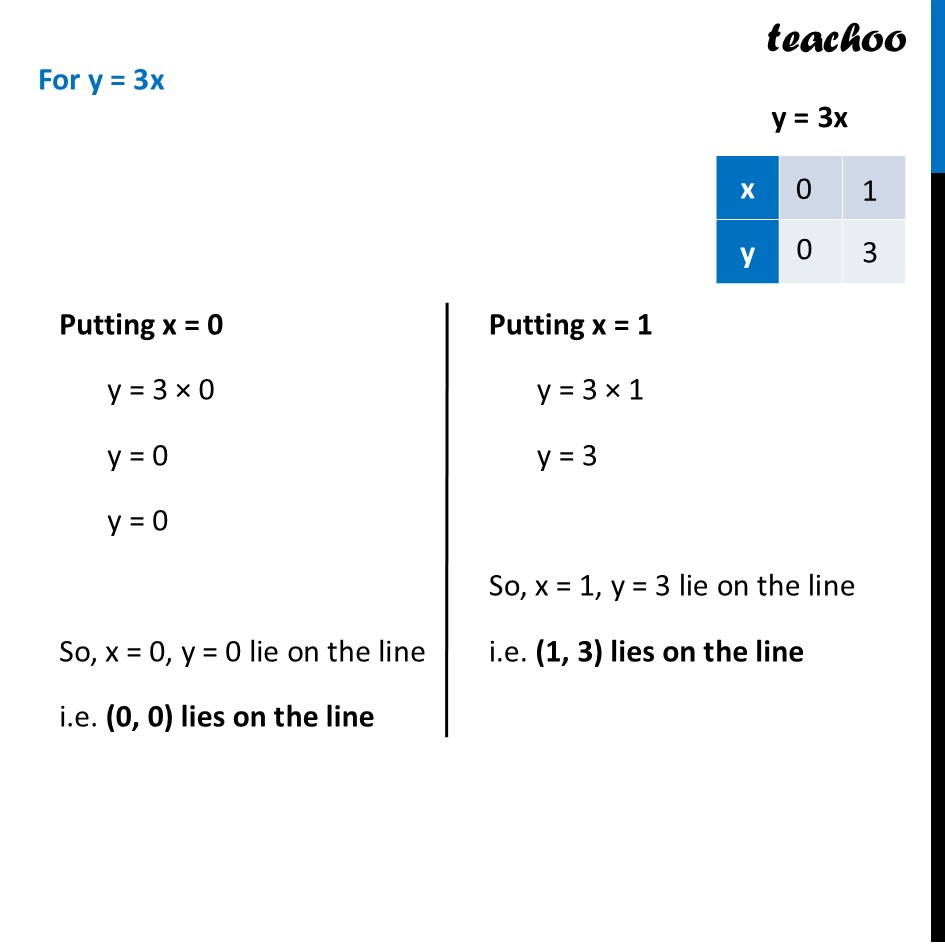
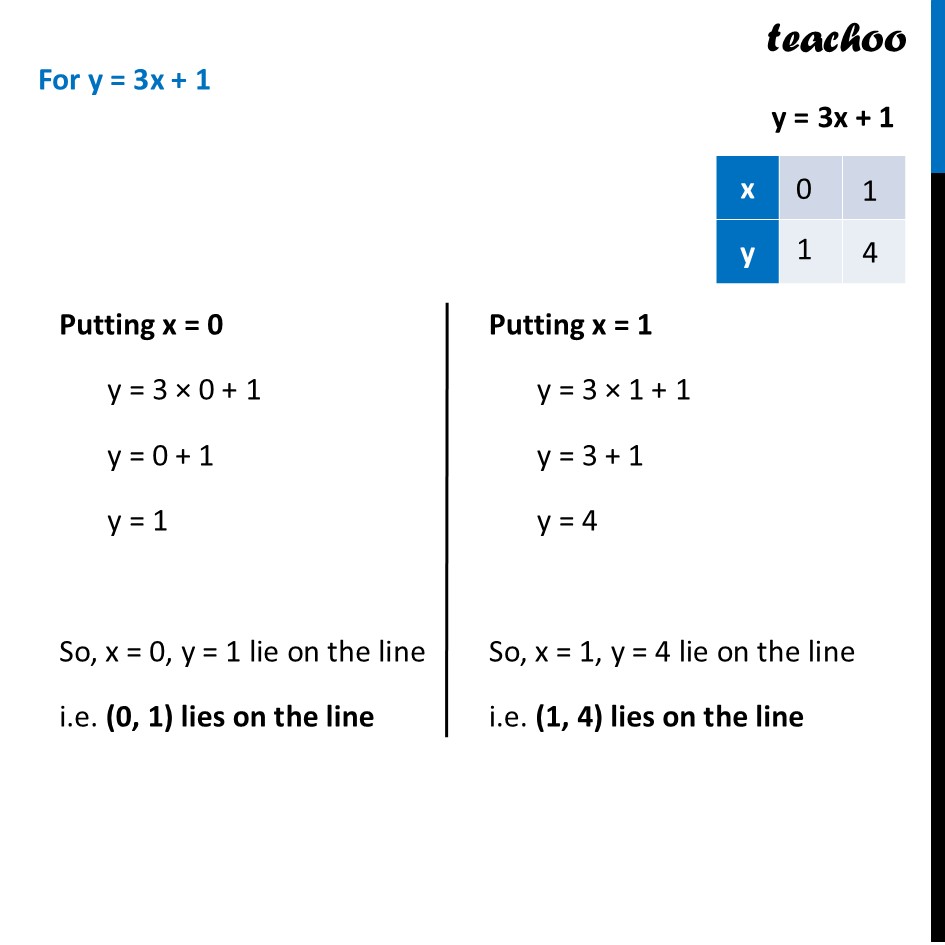
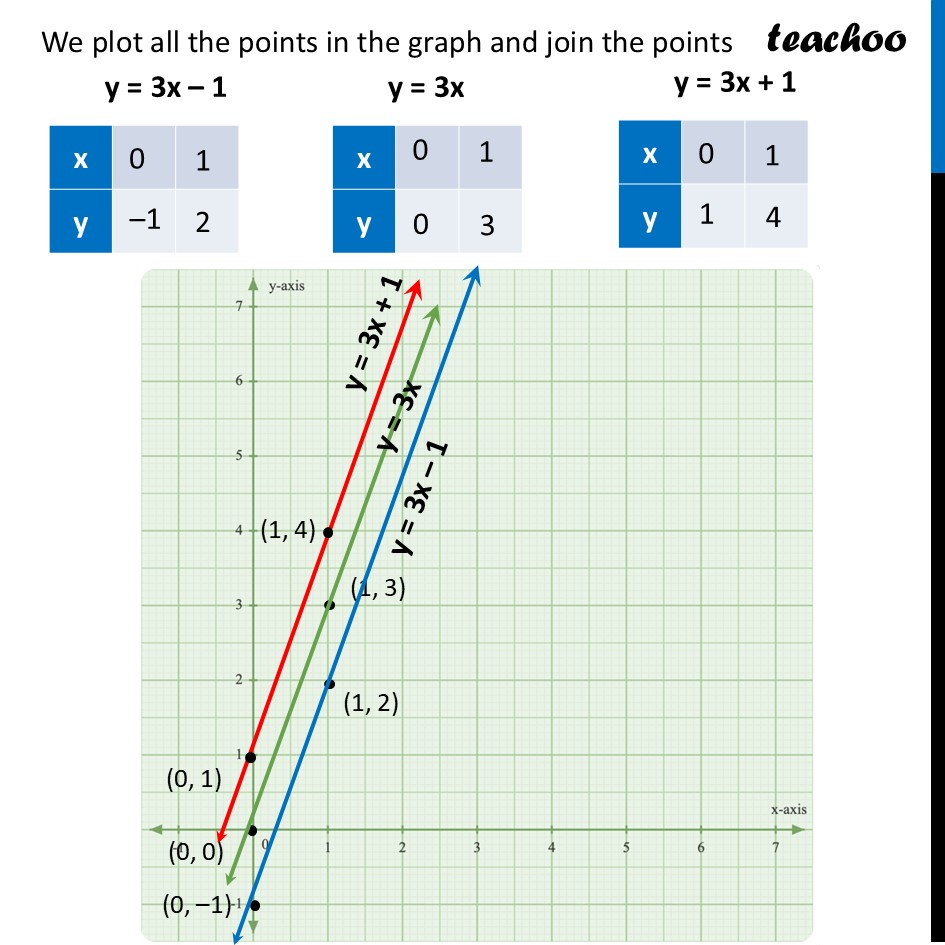
Ex 2.6, 1 (iv) Draw the graphs of the following sets of lines. In each case, reflect on the role of ‘a’ and ‘b’. (iv) y = 3x – 1, y = 3x, y = 3x + 1 To draw the graph, we join points which lie on the line For y = 3x – 1 Putting x = 0 y = 3 × 0 – 1 y = 0 – 1 y = –1 So, x = 0, y = 1 lie on the line i.e. (0, 1) lies on the line Putting x = 1 y = 3 × 1 – 1 y = 3 – 1 y = 2 So, x = 1, y = 2 lie on the line i.e. (1, 2) lies on the line For y = 3x Putting x = 0 y = 3 × 0 y = 0 y = 0 So, x = 0, y = 0 lie on the line i.e. (0, 0) lies on the line Putting x = 1 y = 3 × 1 y = 3 So, x = 1, y = 3 lie on the line i.e. (1, 3) lies on the line For y = 3x + 1 Putting x = 0 y = 3 × 0 + 1 y = 0 + 1 y = 1 So, x = 0, y = 1 lie on the line i.e. (0, 1) lies on the line Putting x = 1 y = 3 × 1 + 1 y = 3 + 1 y = 4 So, x = 1, y = 4 lie on the line i.e. (1, 4) lies on the line We plot all the points in the graph and join the points y = 3x – 1 y = 3x y = 3x + 1 Reflection on 'a' and 'b’ Because the slope 'a' is exactly the same for all three, they have the exact same steepness. This means they are parallel lines that will never touch. Changing the 'b' value simply shifts the line vertically. y = 3x goes through the center, y = 3x + 1 is shifted one unit up, and y = 3x - 1 is shifted one unit down.
