You are here
Last updated at October 23, 2026 by Teachoo
Transcript
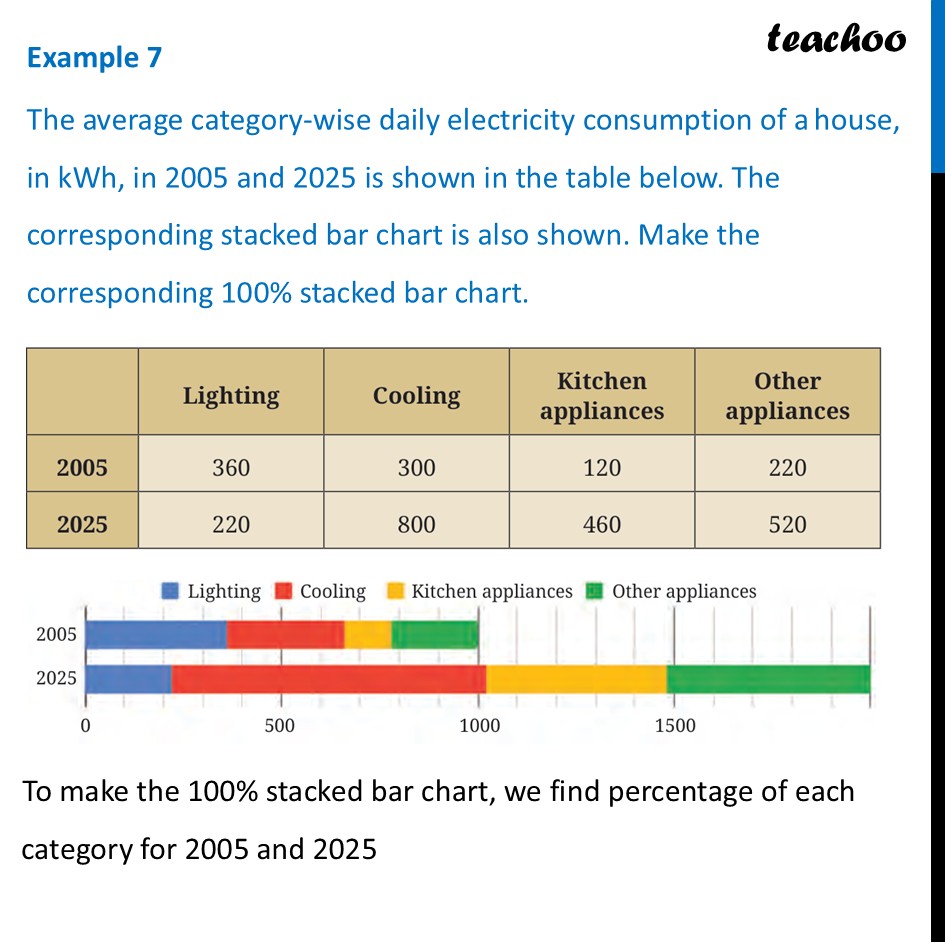
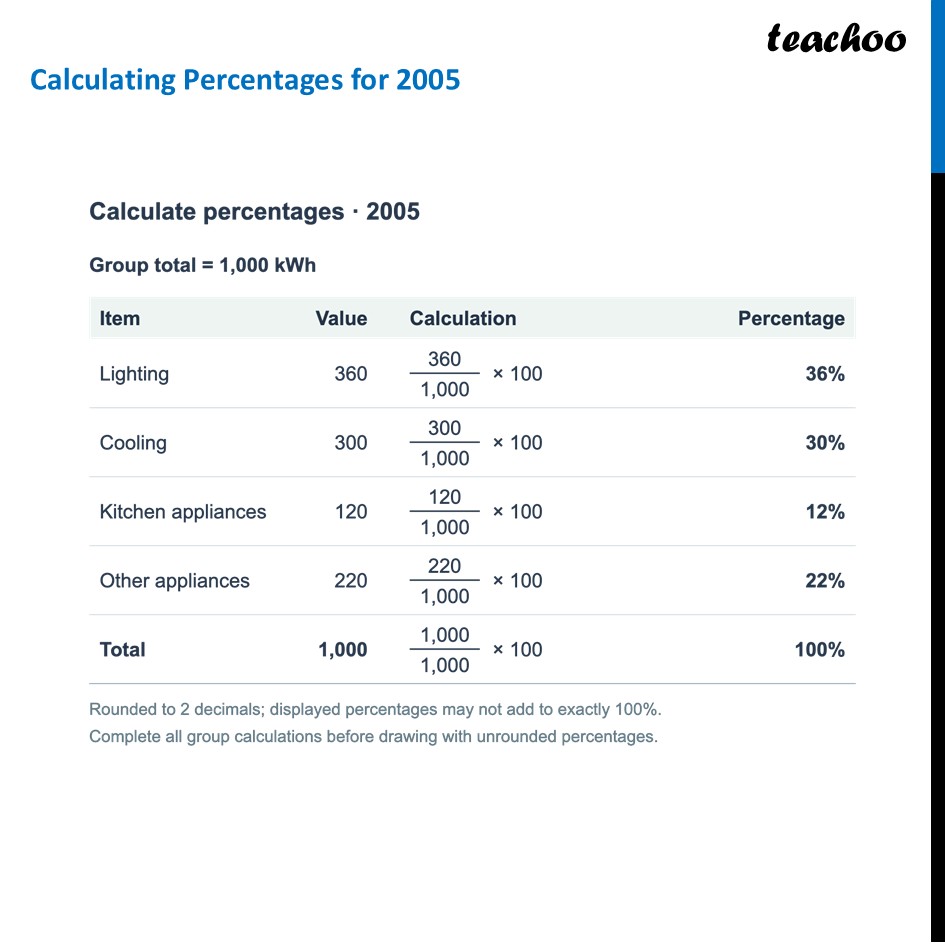
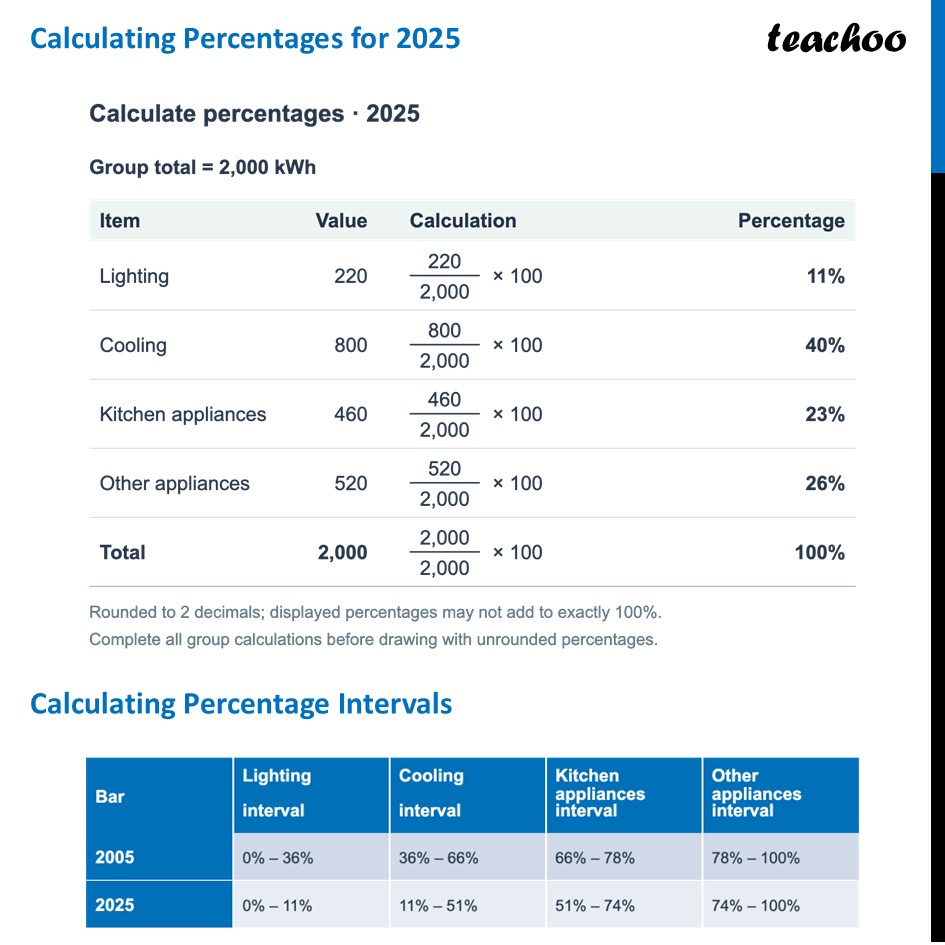
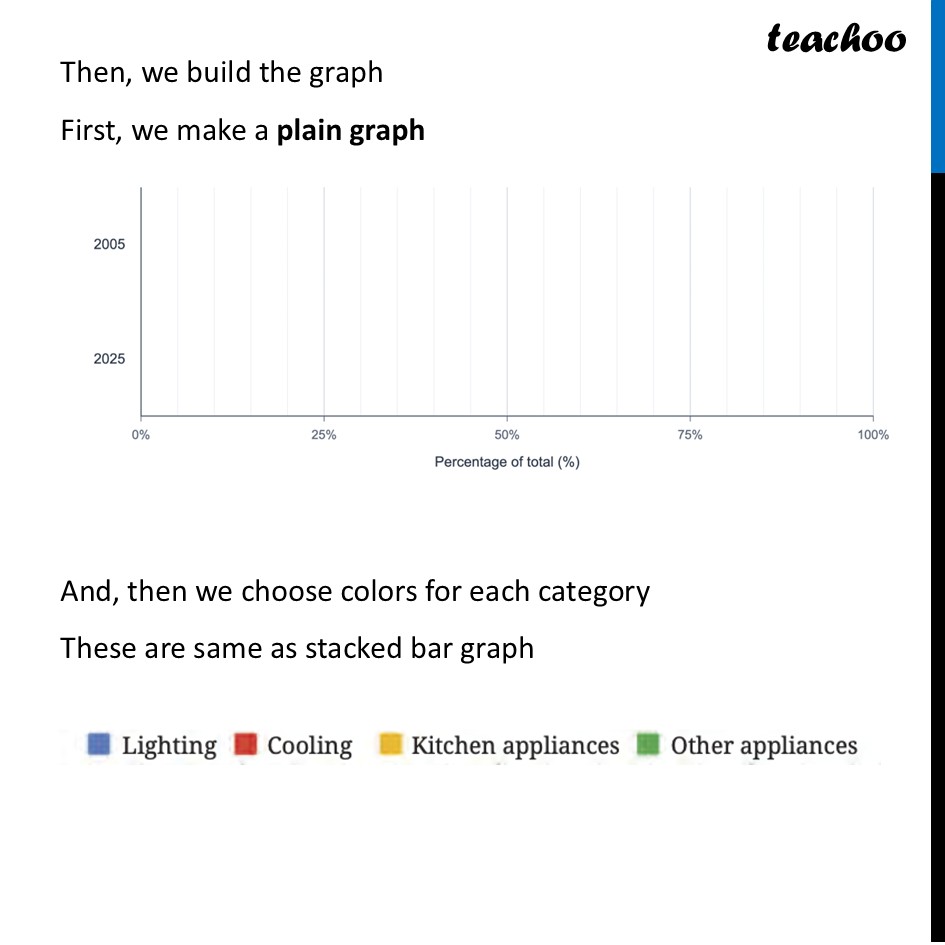
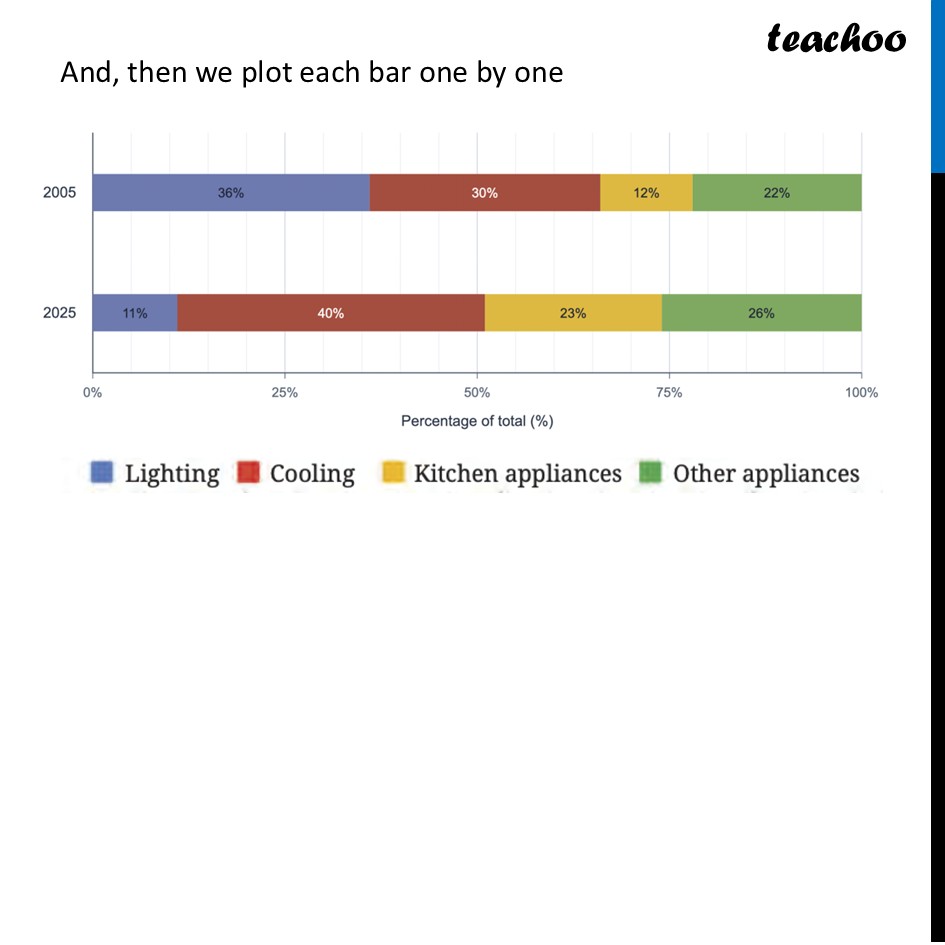
Example 7 The average category-wise daily electricity consumption of a_( )house, in kWh, in 2005 and 2025 is shown in the table below. The corresponding stacked bar chart is also shown. Make the corresponding 100% stacked bar chart. To make the 100% stacked bar chart, we find percentage of each category for 2005 and 2025 Lightin Coolin Kitchen Other 8 8 8 appliances appliances 2005 360 300 120 220 2025 220 800 460 520 ® Lighting Mi Cooling Kitchen appliances ™™ Other appliances 2025 500 1000 1500 Calculating Percentages for 2005 Calculate percentages - 2005 Group total = 1,000 kWh Item Value Lighting 360 Cooling 300 Kitchen appliances 120 Other appliances 220 Total 1,000 Calculation 360 1,000 300 120 220 x 100 Percentage 36% 30% 12% 22% 100% Rounded to 2 decimals; displayed percentages may not add to exactly 100%. Complete all group calculations before drawing with unrounded percentages. Calculating Percentages for 2025 Calculating Percentage Intervals Calculate percentages - 2025 Group total = 2,000 kWh Item Value Lighting 220 Cooling 800 Kitchen appliances 460 Other appliances 520 Total 2,000 Calculation 220 2,000 800 460 520 x 100 Percentage 11% 40% 23% 26% 100% Rounded to 2 decimals; displayed percentages may not add to exactly 100%. Complete all group calculations before drawing with unrounded percentages. Plan the percentage intervals One bar per group; stack categories in the order shown. 2005 = 360 + 300 + 120 + 220 = 1,000 kWh 2025 = 220 + 800 + 460 + 520 = 2,000 kWh Lighting Cooling Kitchen Other appliances appliances interval interval interval interval 0% — 36% 36% — 66% 66% — 78% 18% — 100% 2008 0% — 11% 11% —51% 51% — 74% 74% — 100% Each complete bar runs from 0% to 100%. Follow the graph’s colour key. Boundaries shown to 2 decimals; the graph uses unrounded percentages. Then, we build the graph First, we make a plain graph And, then we choose colors for each category These are same as stacked bar graph 2005 2025 0% 25% 50% 75% 100% Percentage of total (%) ® Lighting M Cooling ® Kitchen appliances ™® Other appliances And, then we plot each bar one by one 2005 2025 0% 25% 50% 75% 100% Percentage of total (%) ® Lighting M Cooling ® Kitchen appliances ™® Other appliances