You are here
Draw a market equilibrium graph using the given demand schedule.
| Price (Rs) | 10 | 20 | 30 | 40 | 50 |
|---|---|---|---|---|---|
| Q.D. (kg) | 5 | 10 | 15 | 20 | 25 |
| Q.S. (kg) | 25 | 20 | 15 | 10 | 5 |
a. Plot the demand and supply curve using the above data. b. Identify the equilibrium price and quantity. c. Observe the above data and analyse what happens if the price is set at Rs 20 or Rs 40.
Concept
Market Equilibrium
Show Answer
| Price (Rs) | 10 | 20 | 30 | 40 | 50 |
|---|---|---|---|---|---|
| Q.D. (kg) | 5 | 10 | 15 | 20 | 25 |
| Q.S. (kg) | 25 | 20 | 15 | 10 | 5 |
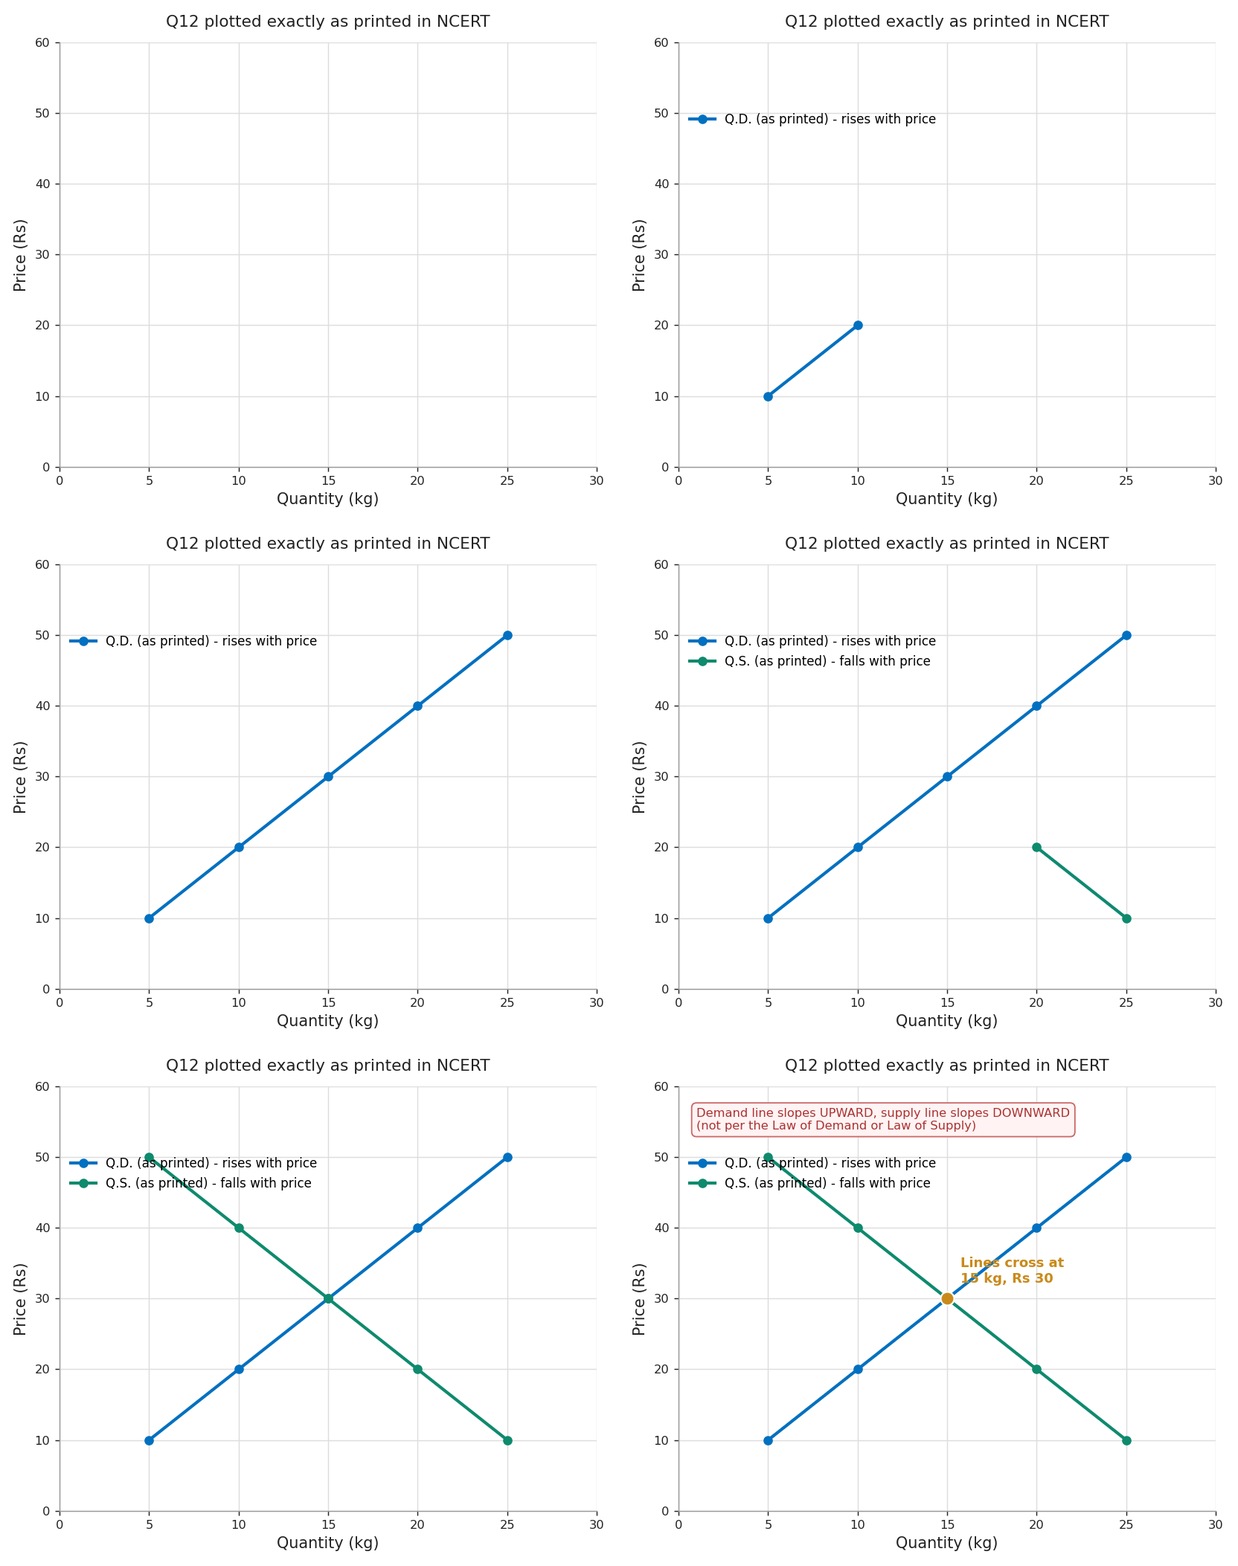
Q12 plotted exactly as printed in NCERT
- a. Plot price on the y-axis and quantity on the x-axis. Join the Q.D. points to get the demand line, and join the Q.S. points to get the supply line.
- b. The two lines cross where Q.D. = Q.S. = 15 kg. Equilibrium price = Rs 30, Equilibrium quantity = 15 kg.
| Price | Q.D. | Q.S. | Result |
|---|---|---|---|
| Rs 20 | 10 kg | 20 kg | Excess supply of 10 kg |
| Rs 40 | 20 kg | 10 kg | Excess demand of 10 kg |
Note on the printed data
- In the printed table, quantity demanded rises as price rises, and quantity supplied falls as price rises.
- This is inconsistent with the Law of Demand and the Law of Supply taught earlier in this chapter.
- So the printed demand line slopes upward and the supply line slopes downward.
Possible correction (explanatory version, not NCERT): if the two rows were swapped, the data would follow both laws:
| Price | Rs 10 | Rs 20 | Rs 30 | Rs 40 | Rs 50 |
|---|---|---|---|---|---|
| Quantity demanded (kg) | 25 | 20 | 15 | 10 | 5 |
| Quantity supplied (kg) | 5 | 10 | 15 | 20 | 25 |
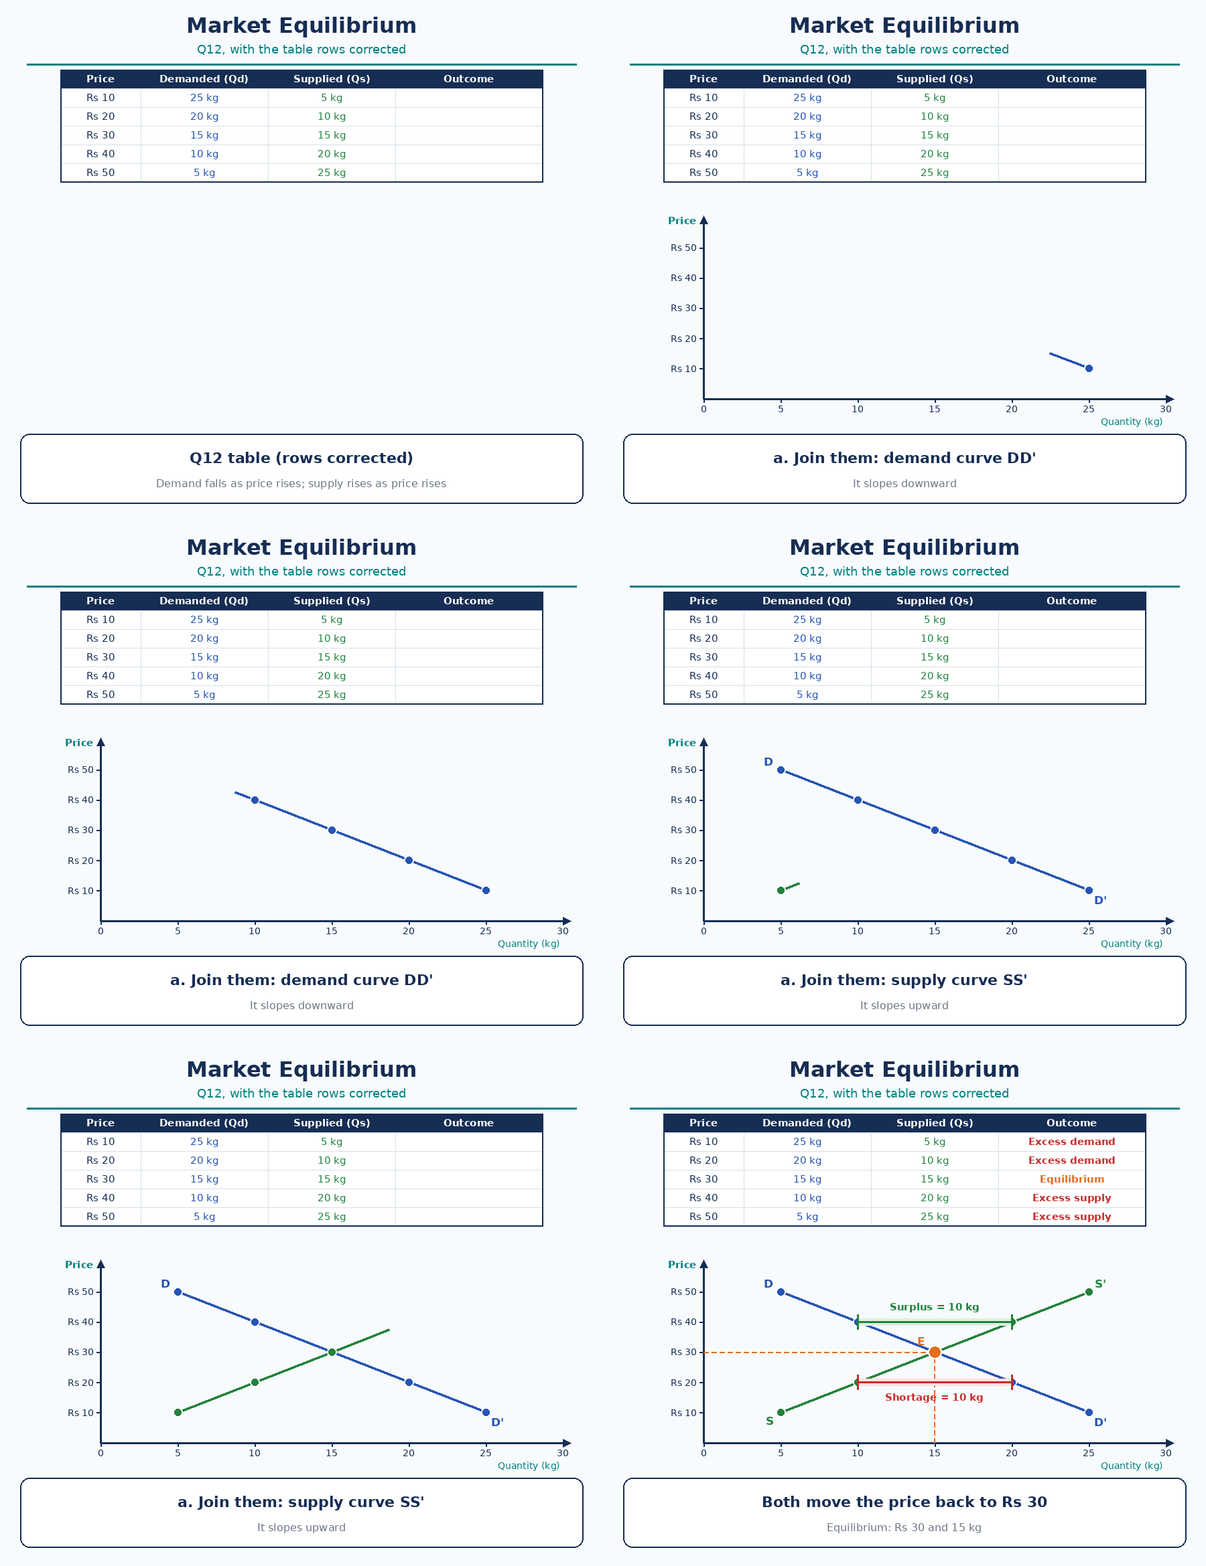
Explanatory version with the rows swapped, not NCERT
- The equilibrium is still Rs 30 and 15 kg. In this version, the demand curve slopes downward and the supply curve slopes upward, as the Law of Demand and the Law of Supply predict.
| Price | Demand | Supply | Result | What happens next |
|---|---|---|---|---|
| Rs 20 | 20 kg | 10 kg | Shortage of 10 kg | Price rises towards Rs 30 |
| Rs 40 | 10 kg | 20 kg | Surplus of 10 kg | Price falls towards Rs 30 |