You are here
In the table below, different prices of guava are given. a. Think and write how much guava you will buy at each price. b. Ask the same question to three of your friends and fill in the table. c. Also make a graph for each one of you and one final graph for the total quantity.
Concept
Demand and the Law of Demand
Show Answer
Sample answer (your numbers will differ):
| Price | You | Friend 1 | Friend 2 | Friend 3 | Total |
|---|---|---|---|---|---|
| Rs 100/kg | 1 kg | 0 kg | 0 kg | 0 kg | 1 kg |
| Rs 80/kg | 2 kg | 1 kg | 1 kg | 1 kg | 5 kg |
| Rs 50/kg | 3 kg | 2 kg | 2 kg | 3 kg | 10 kg |
| Rs 20/kg | 5 kg | 4 kg | 3 kg | 4 kg | 16 kg |
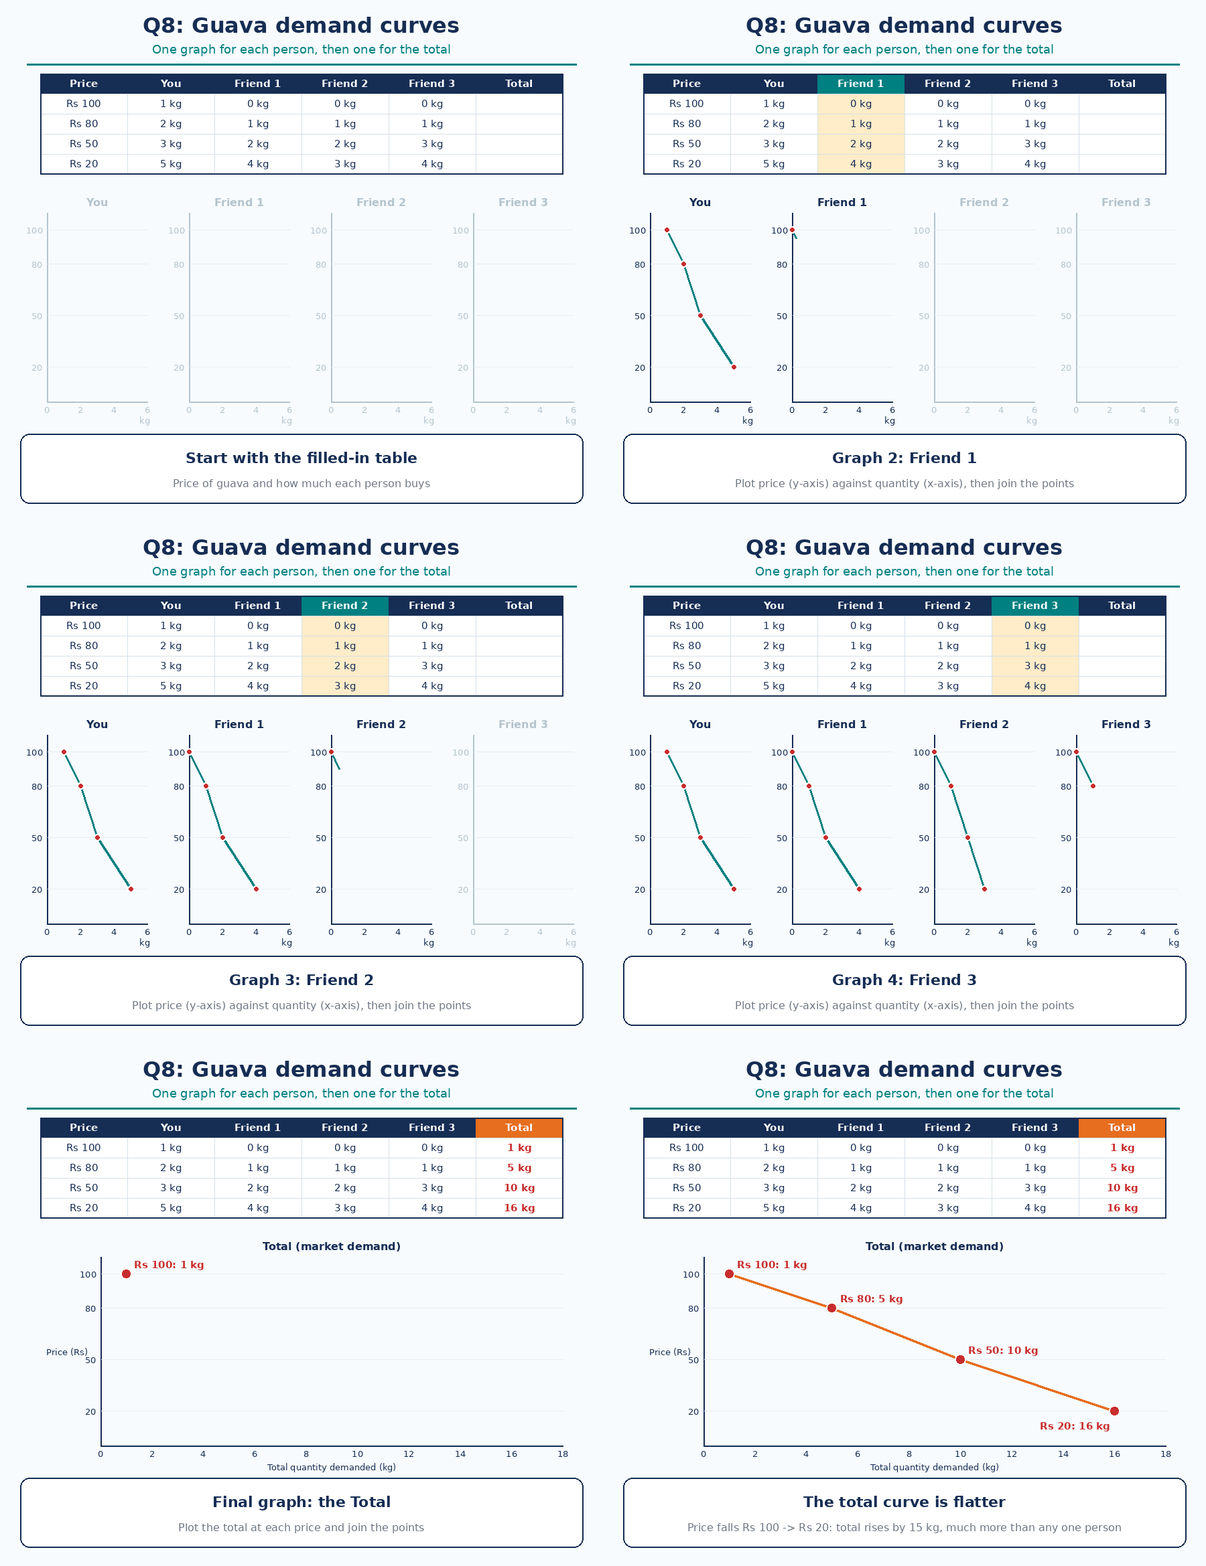
Four individual demand curves, then the total demand curve
- Price is on the y-axis and quantity on the x-axis. Each person's graph slopes downward.
- The total graph is the market demand curve. It is flatter, because the total rises by 15 kg as the price falls from Rs 100 to Rs 20.