You are here
Fig. 9.8 shows the demand curve DD' and Supply curve SS'. a. What does point E represent in this market? b. What is the equilibrium price and equilibrium quantity at point E? c. Point A lies on DD'. Point B lies on SS'. What do the points A and B indicate about demand and supply? What does the gap between A and B (both on the upper dashed price line) represent? d. Point F lies on DD'. Point C lies on SS'. What do the points F and C indicate about demand and supply? What does the gap between C and F (both on the lower dashed price line) represent? e. If the price stays at the lower dashed line, what could happen next in a free market?
Concept
Market Equilibrium
Show Answer
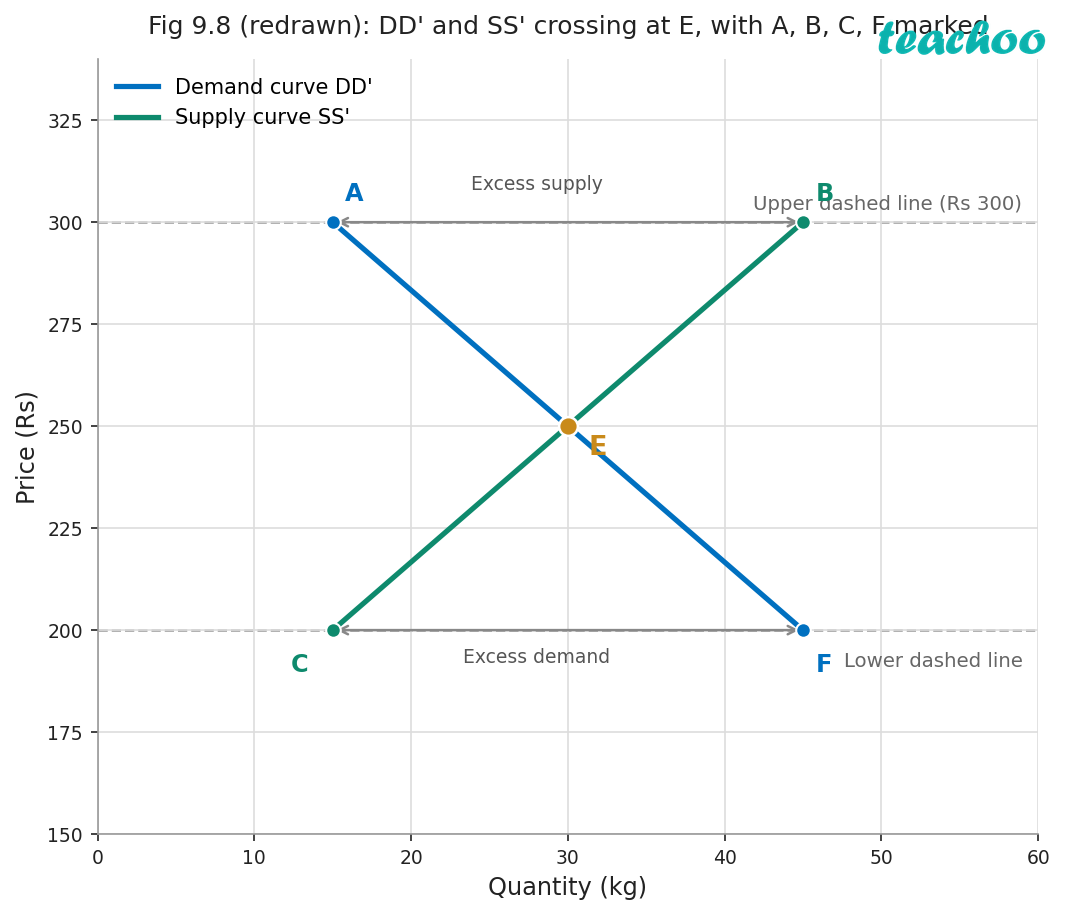
Fig 9.8 redrawn: DD' and SS' crossing at E, with points A, B, C, F on the dashed lines
| Price line | Demand point | Supply point | Gap |
|---|---|---|---|
| Upper dashed line (Rs 300) | A | B | Excess supply (surplus) |
| Equilibrium (E) | 30 kg at about Rs 250 | No gap | |
| Lower dashed line | F | C | Excess demand (shortage) |
- a. E is the market equilibrium , the point where the demand curve and the supply curve cross. Demand equals supply there.
- b. The figure does not print E's values. Reading the graph: equilibrium quantity is 30 kg , and equilibrium price is about Rs 250 , halfway between Rs 200 and Rs 300.
- c. On the upper dashed line (Rs 300), above E: A shows the quantity demanded, B shows the quantity supplied. B is further right than A, so supply is more than demand. The gap between A and B is excess supply (surplus) .
- d. On the lower dashed line, below E: F shows the quantity demanded, C shows the quantity supplied. F is further right than C, so demand is more than supply. The gap between C and F is excess demand (shortage) .
- e. At the lower price there is a shortage. Buyers compete for the limited goods, so the price rises. It keeps rising until it reaches E, where the shortage disappears.