Visualising a GP
Last updated at June 9, 2026 by Teachoo
Transcript
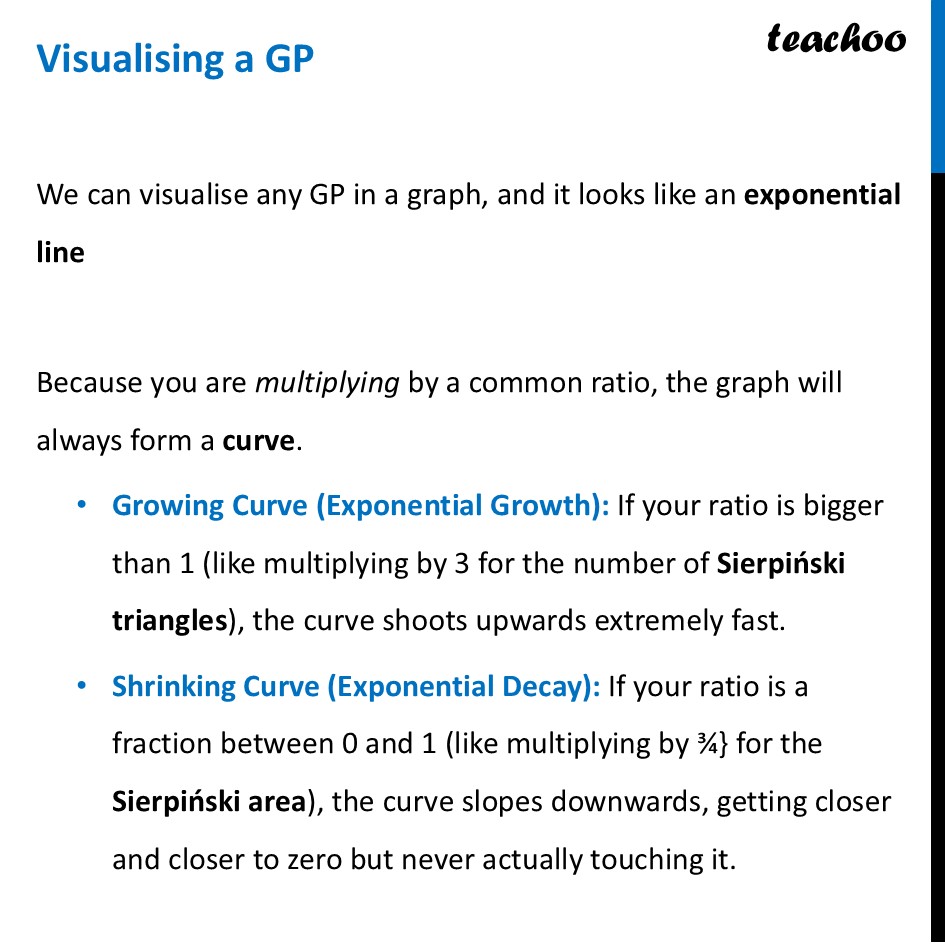
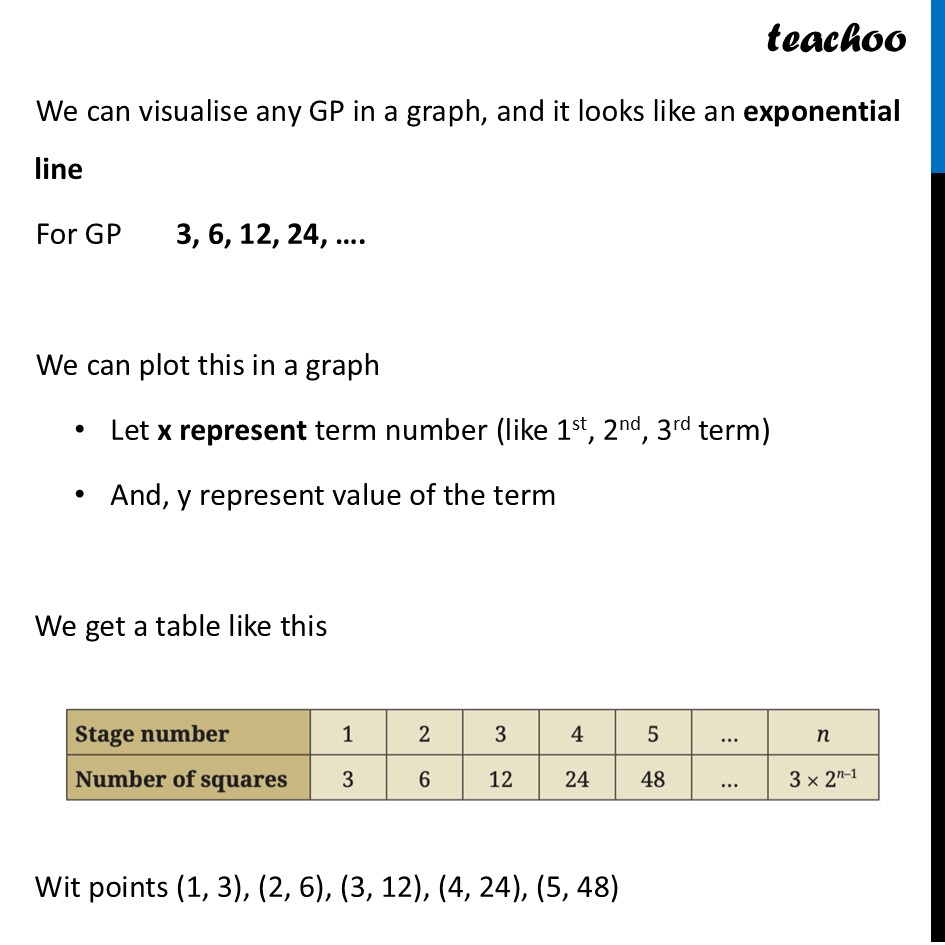
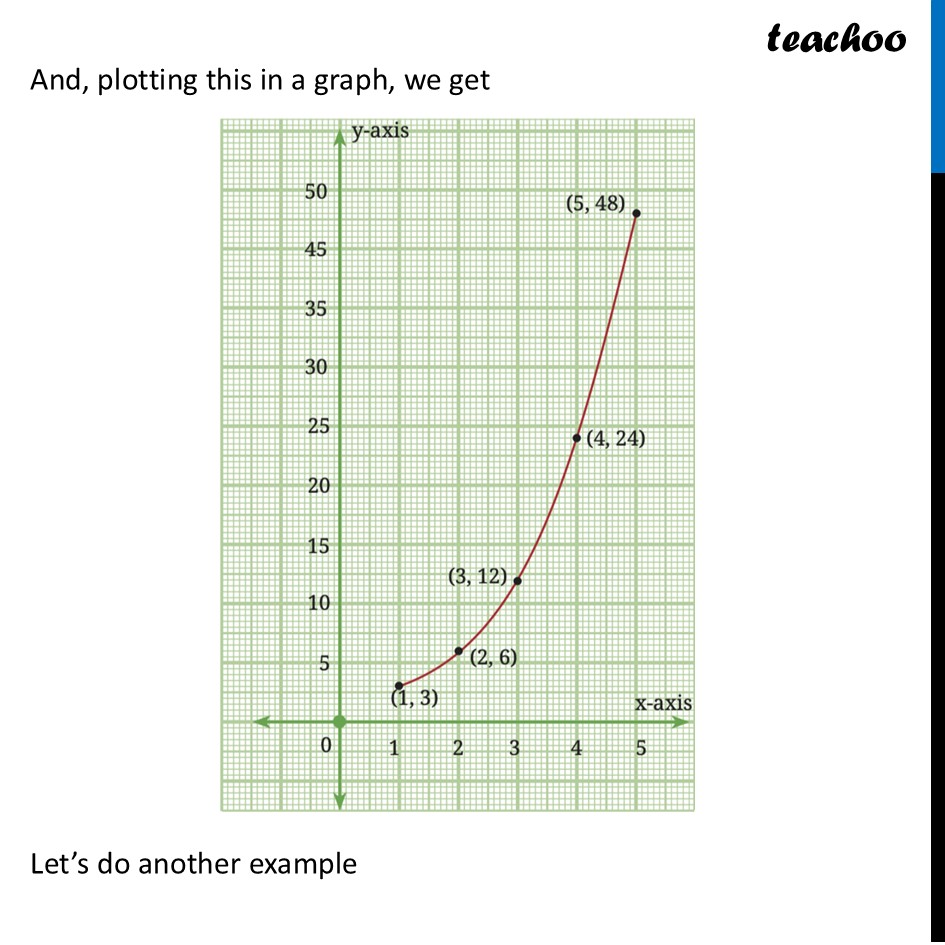
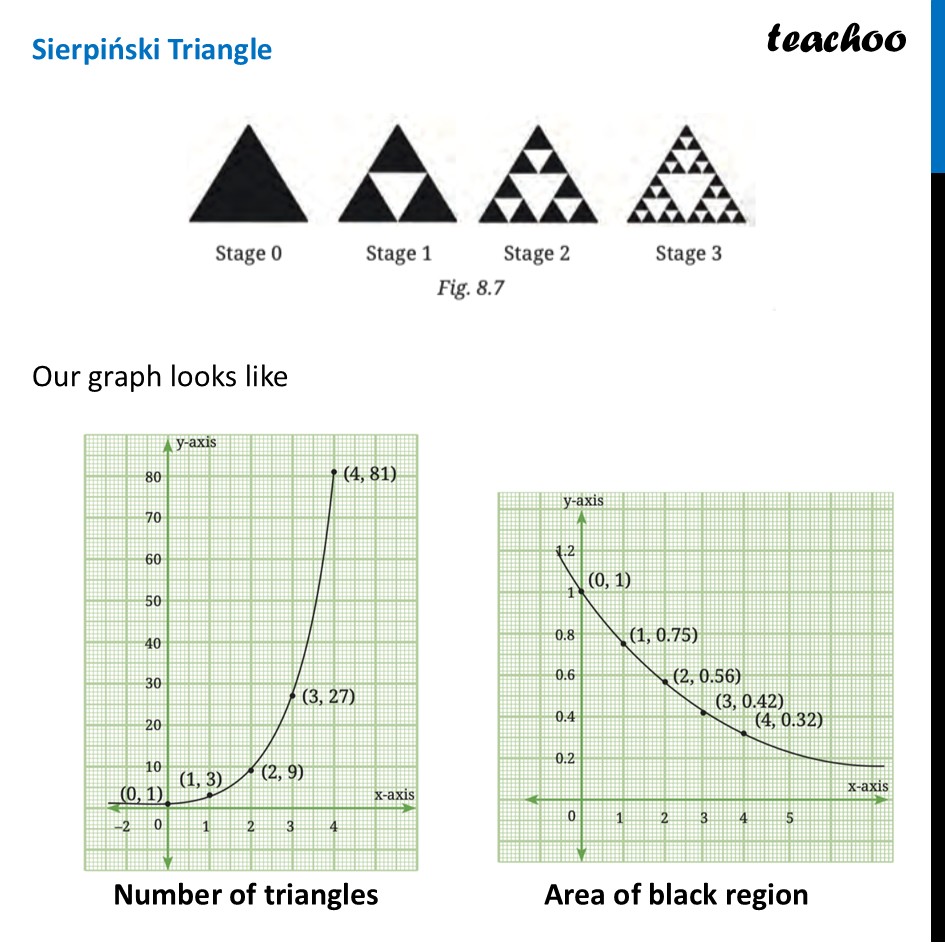
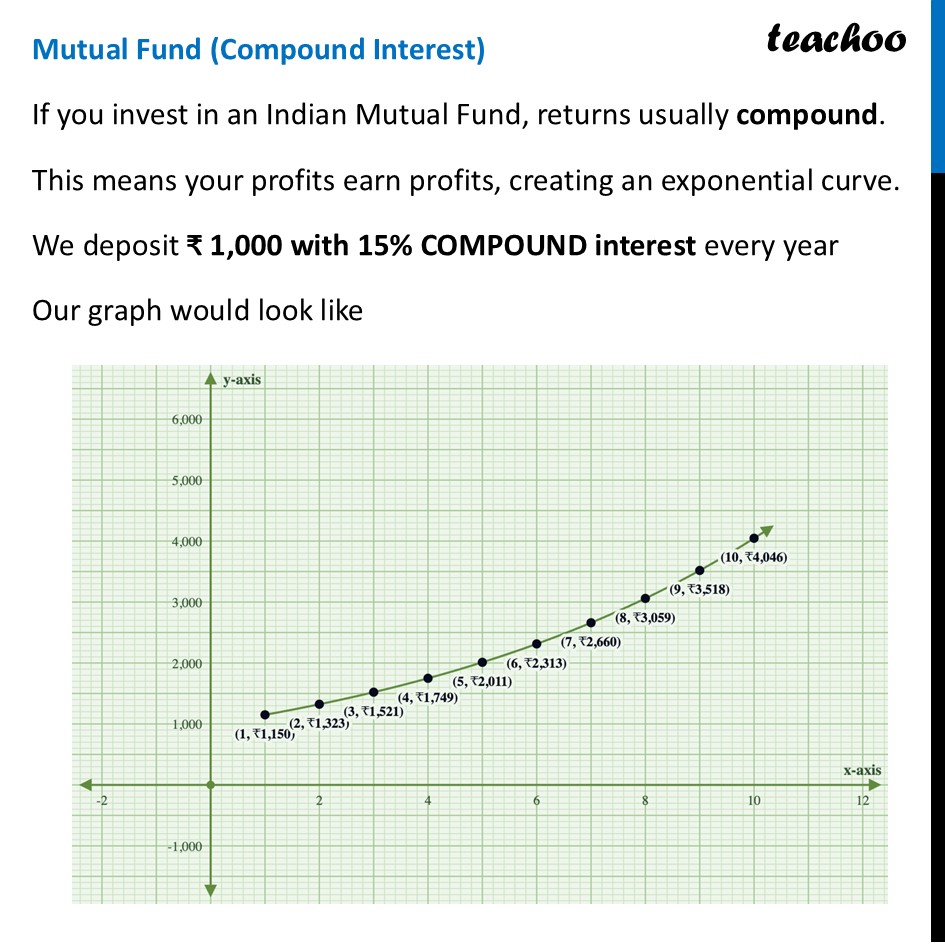
Visualising a GP We can visualise any GP in a graph, and it looks like an exponential line Because you are multiplying by a common ratio, the graph will always form a curve. Growing Curve (Exponential Growth): If your ratio is bigger than 1 (like multiplying by 3 for the number of Sierpiński triangles), the curve shoots upwards extremely fast. Shrinking Curve (Exponential Decay): If your ratio is a fraction between 0 and 1 (like multiplying by ¾} for the Sierpiński area), the curve slopes downwards, getting closer and closer to zero but never actually touching it. We can visualise any GP in a graph, and it looks like an exponential line For GP 3, 6, 12, 24, …. We can plot this in a graph Let x represent term number (like 1st, 2nd, 3rd term) And, y represent value of the term We get a table like this Wit points (1, 3), (2, 6), (3, 12), (4, 24), (5, 48) And, plotting this in a graph, we get Let’s do another example Number of triangles Area of black region Mutual Fund (Compound Interest) If you invest in an Indian Mutual Fund, returns usually compound. This means your profits earn profits, creating an exponential curve. We deposit ₹ 1,000 with 15% COMPOUND interest every year Our graph would look like
