Figure it out - Page 127-132

 You are here
Last updated at August 14, 2026 by Teachoo
Transcript
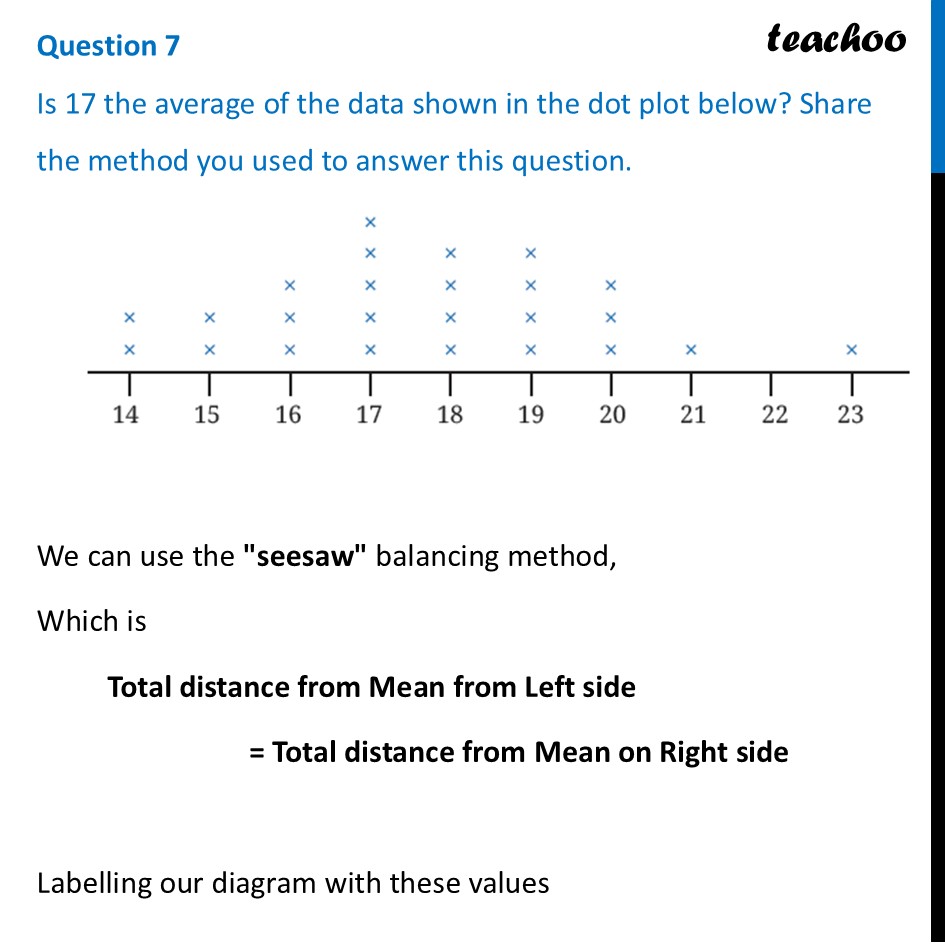
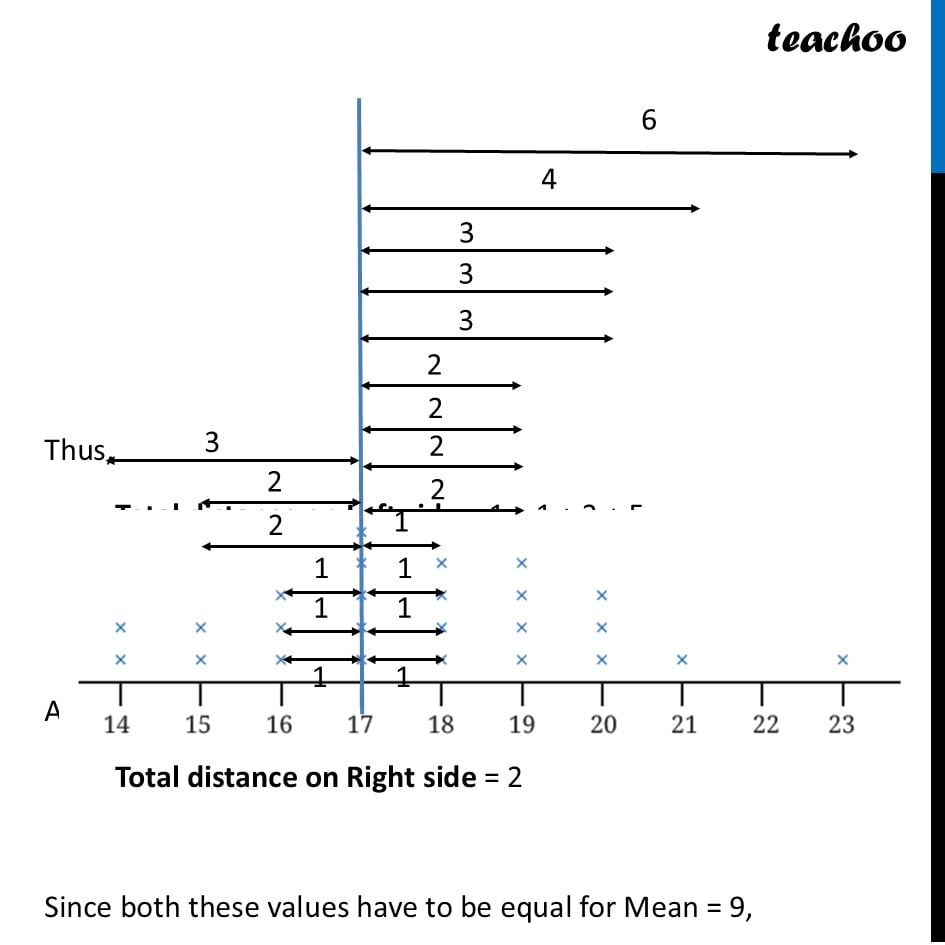
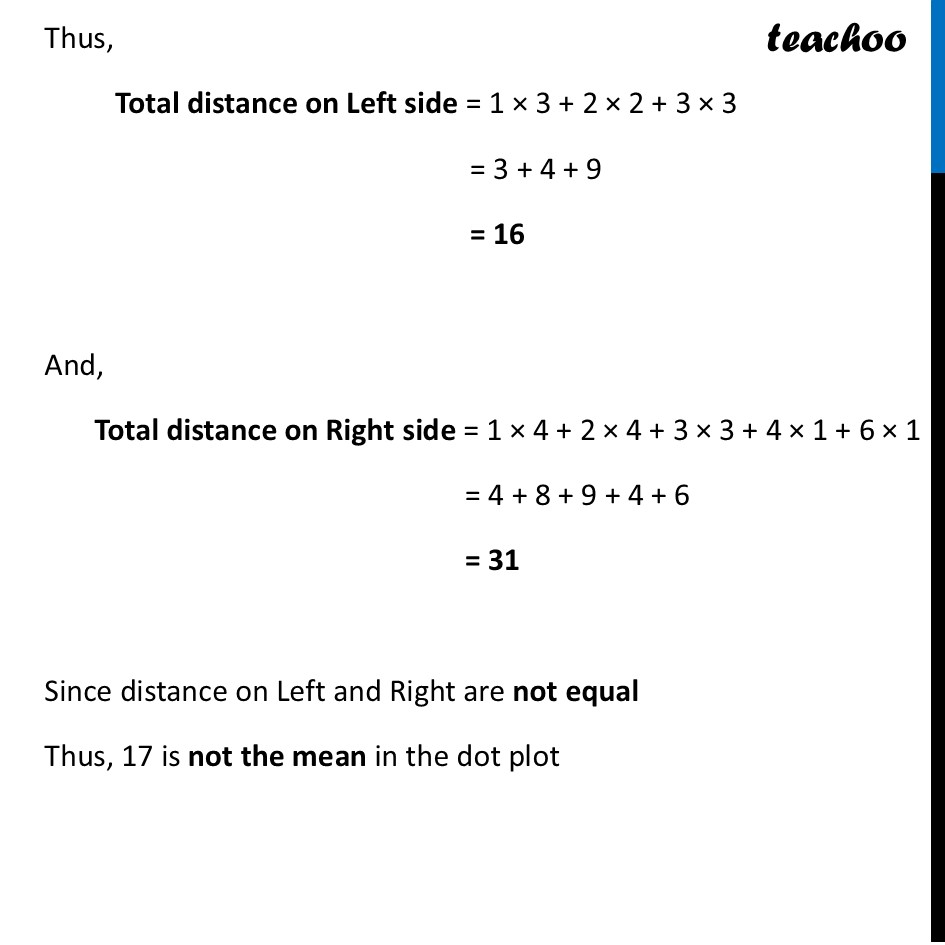
Question 7 Is 17 the average of the data shown in the dot plot below? Share the method you used to answer this question.We can use the "seesaw" balancing method, Which is Total distance from Mean from Left side = Total distance from Mean on Right side Labelling our diagram with these values Thus, Total distance on Left side = 1 + 1 + 2 + 5 = 9 And, Total distance on Right side = 2 Since both these values have to be equal for Mean = 9, Thus, Total distance on Left side = 1 × 3 + 2 × 2 + 3 × 3 = 3 + 4 + 9 = 16 And, Total distance on Right side = 1 × 4 + 2 × 4 + 3 × 3 + 4 × 1 + 6 × 1 = 4 + 8 + 9 + 4 + 6 = 31 Since distance on Left and Right are not equal Thus, 17 is not the mean in the dot plot