Last updated at March 5, 2026 by Teachoo
Transcript
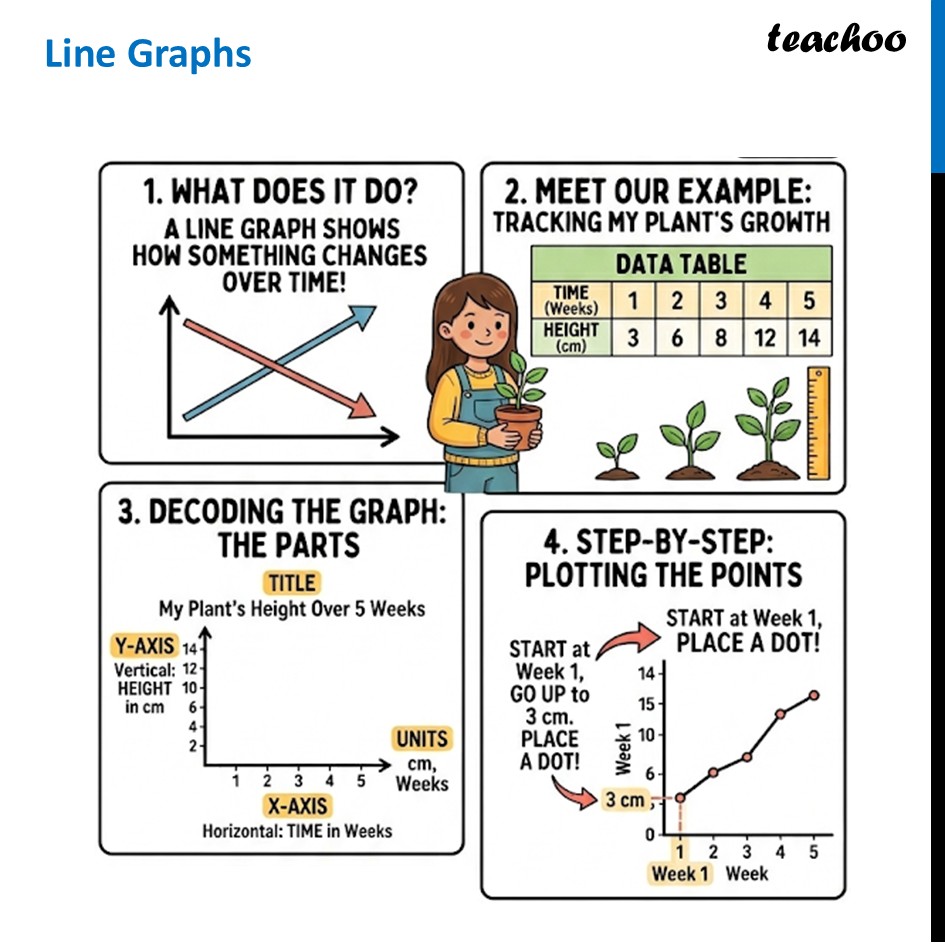
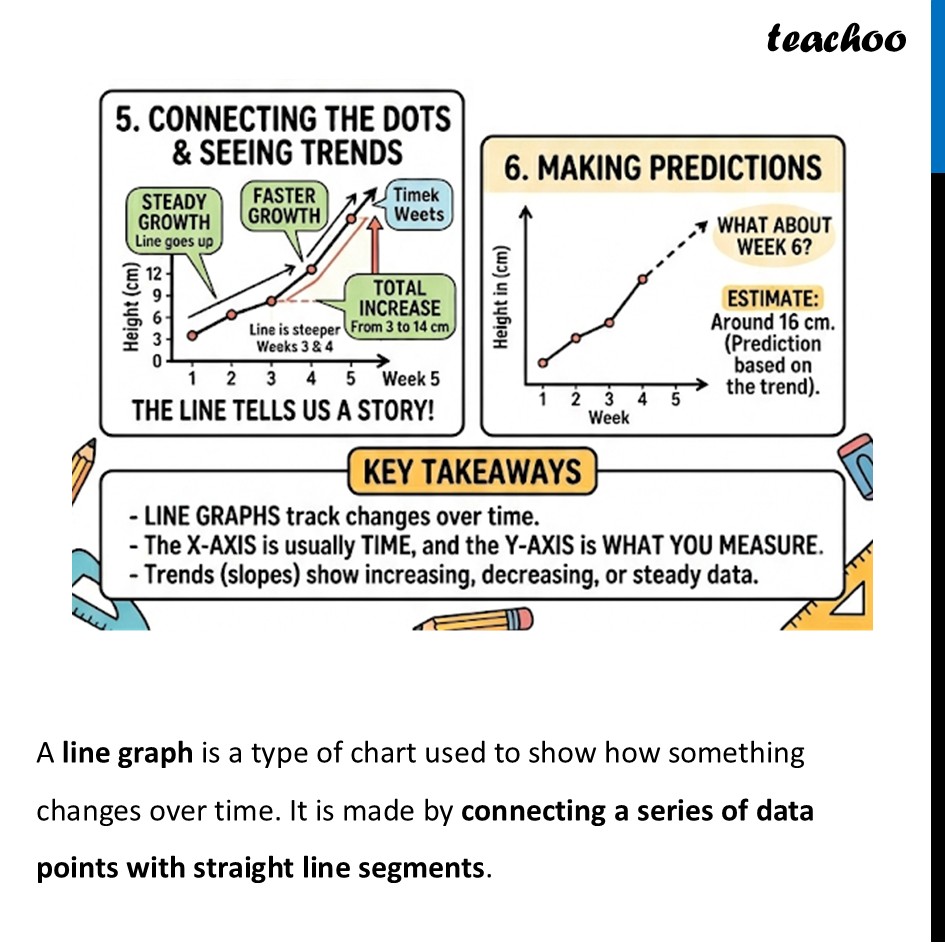
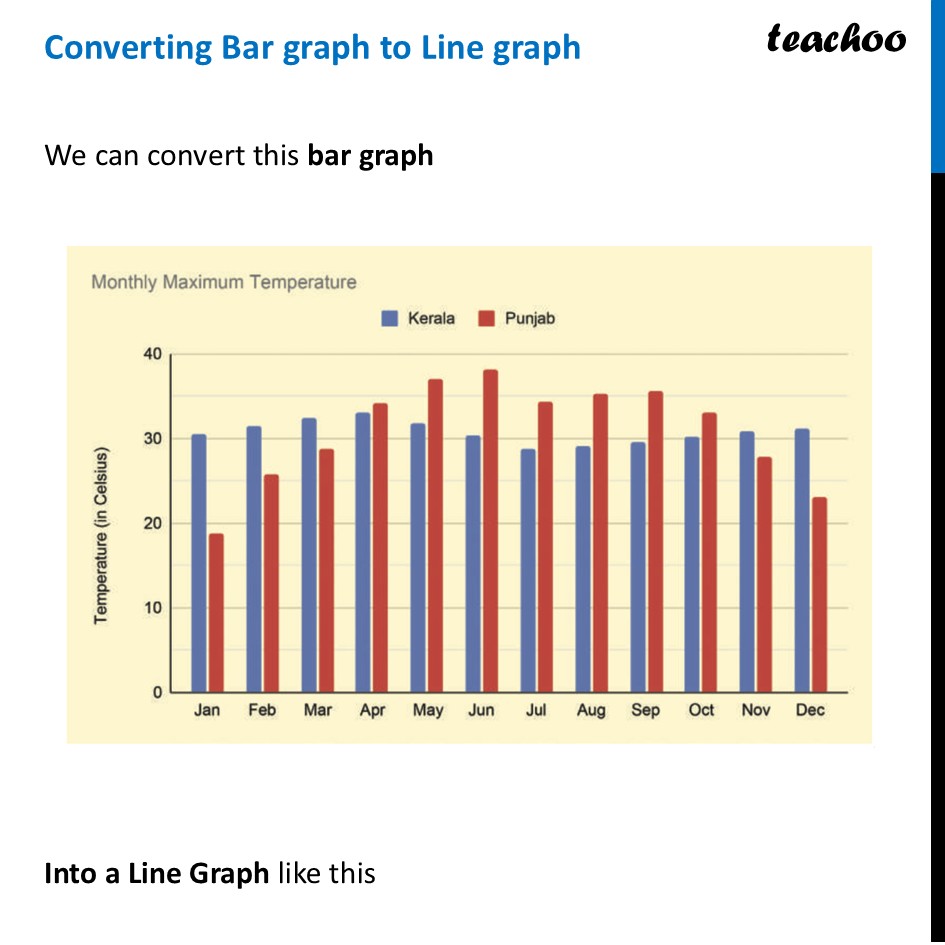
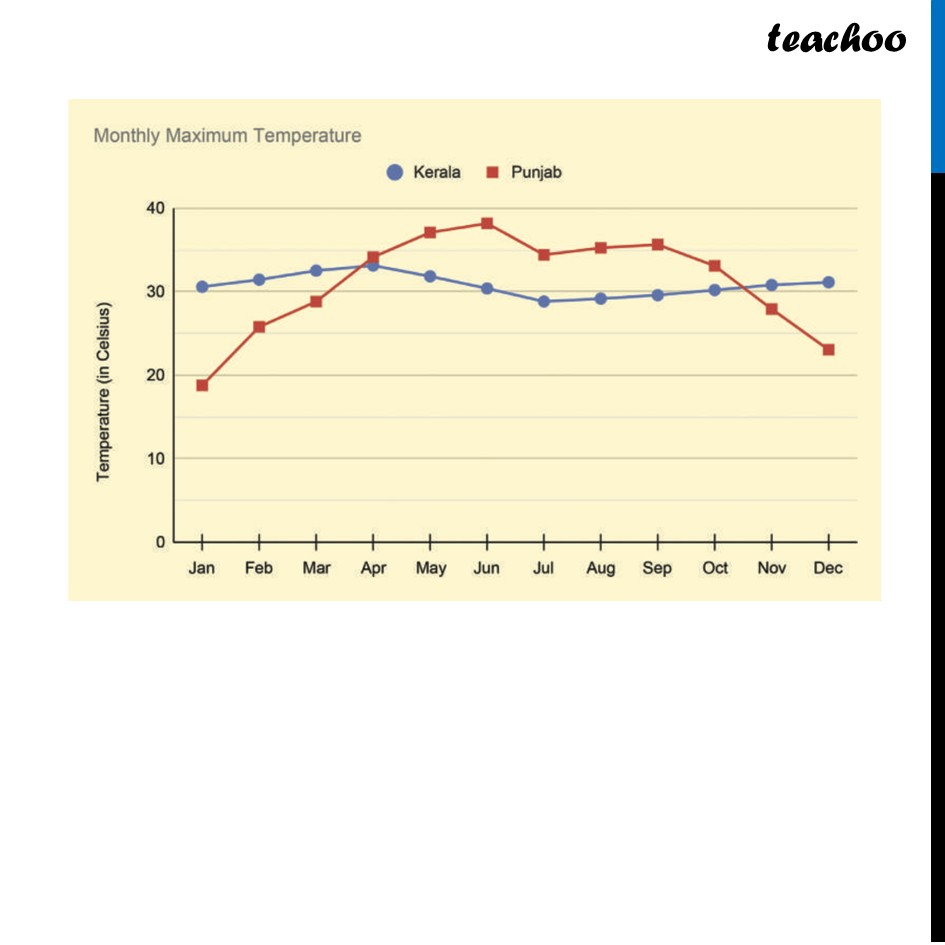
Line Graphs WHAT DOES IT DO? A LINE GRAPH SHOWS 2. MEET OUR EXAMPLE: HOW SOMETHING CHANGES OVER TIME! Table 1: TRACKING MY PLANT'S GROWTH \captionsetup{labelformat=empty} DATA TABLE TIME (Weeks) 1 2 3 4 5 HElGHT 3 6 8 12 14 DECODING THE GRAPH: THE PARTS TITLE My Plant's Height Over 5 Weeks Horizontal: TIME in Weeks 4. STEP-BY-STEP: PLOTTING THE POINTSCONNECTING THE DOTS & SEEING TRENDS THE LINE TELLS US A STORY! 6. MAKING PREDICTIONS KEY TAKEAWAYS LINE GRAPHS track changes over time. The X-AXIS is usually TIME, and the Y-AXIS is WHAT YOU MEASURE. Trends (slopes) show increasing, decreasing, or steady data. Converting Bar graph to Line graphWe can convert this bar graph Into a Line Graph like this
