You are here

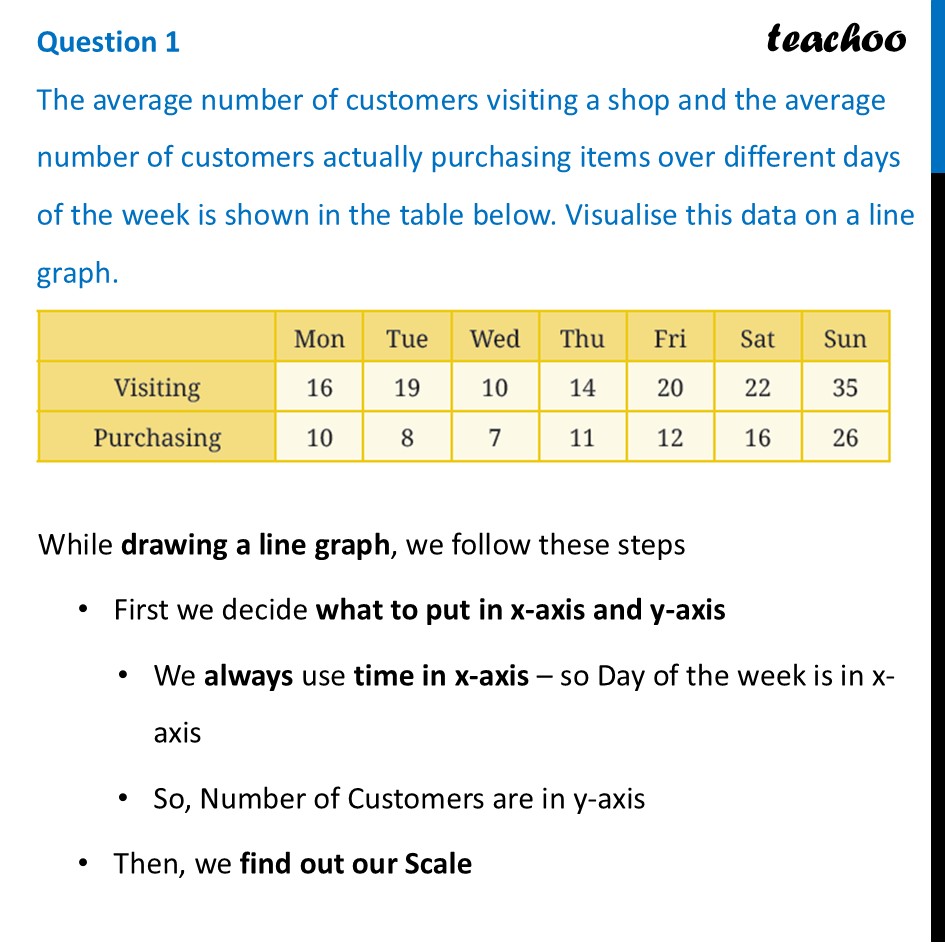
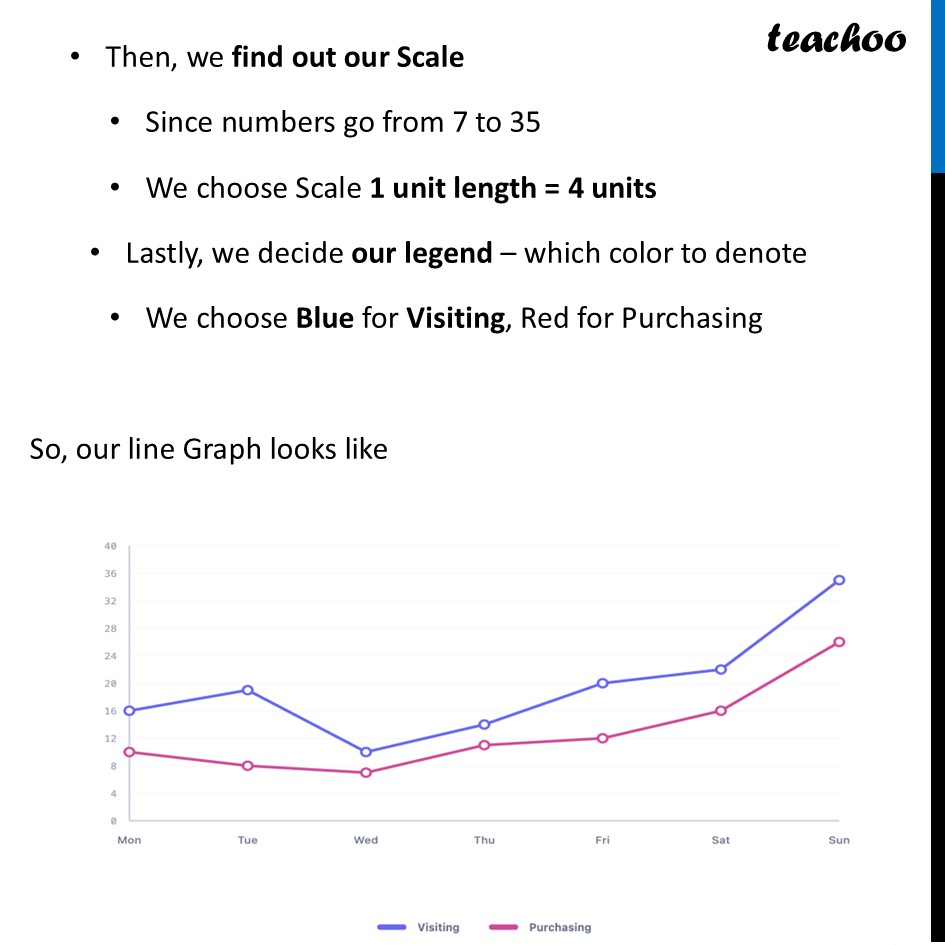
Figure it out - Page 122-123
Last updated at August 14, 2026 by Teachoo
Transcript
Question 1 The average number of customers visiting a shop and the average number of customers actually purchasing items over different days of the week is shown in the table below. Visualise this data on a line graph.While drawing a line graph, we follow these steps First we decide what to put in x-axis and y-axis We always use time in x-axis – so Day of the week is in x-axis So, Number of Customers are in y-axis Then, we find out our Scale Then, we find out our Scale Since numbers go from 7 to 35 We choose Scale 1 unit length = 4 units Lastly, we decide our legend – which color to denote We choose Blue for Visiting, Red for Purchasing So, our line Graph looks like