
Last updated at February 2, 2026 by Teachoo
Transcript
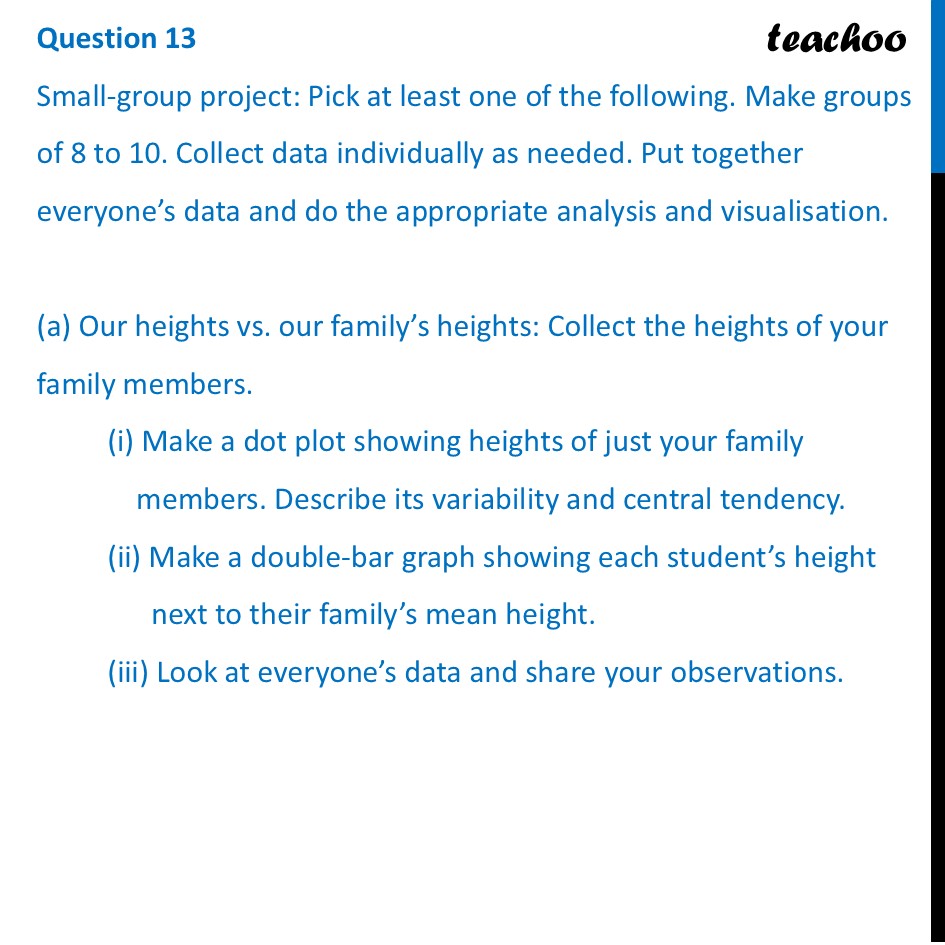
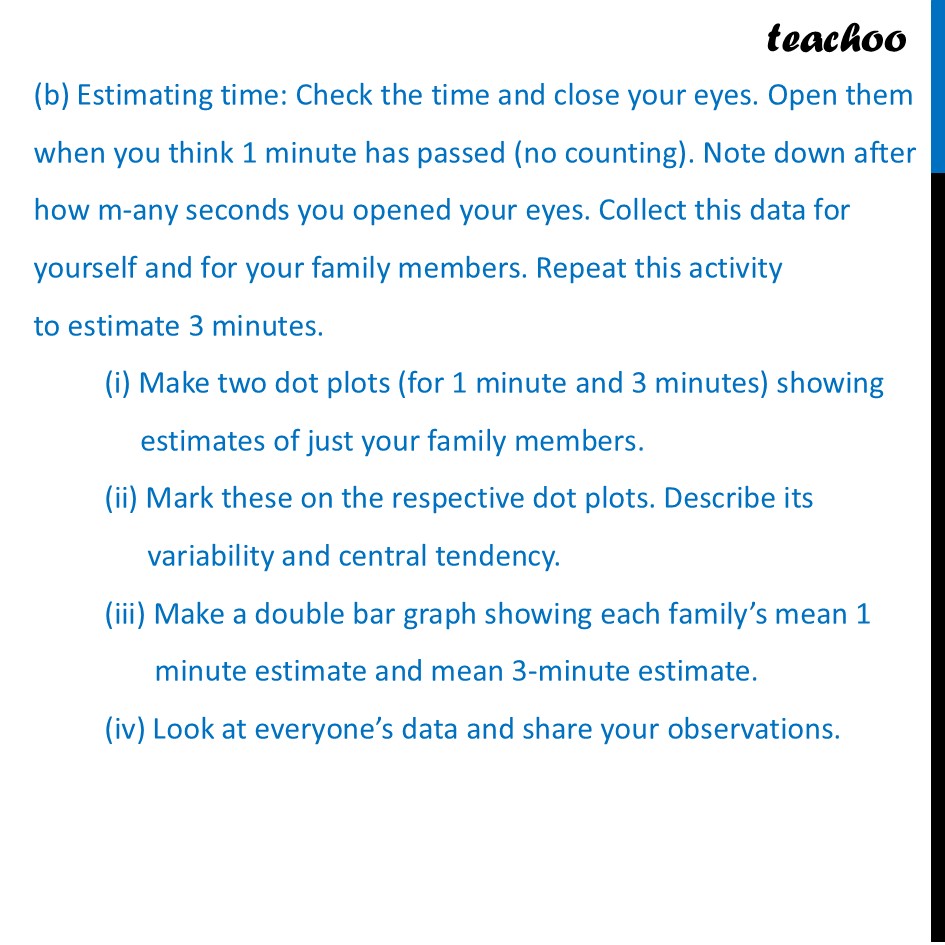
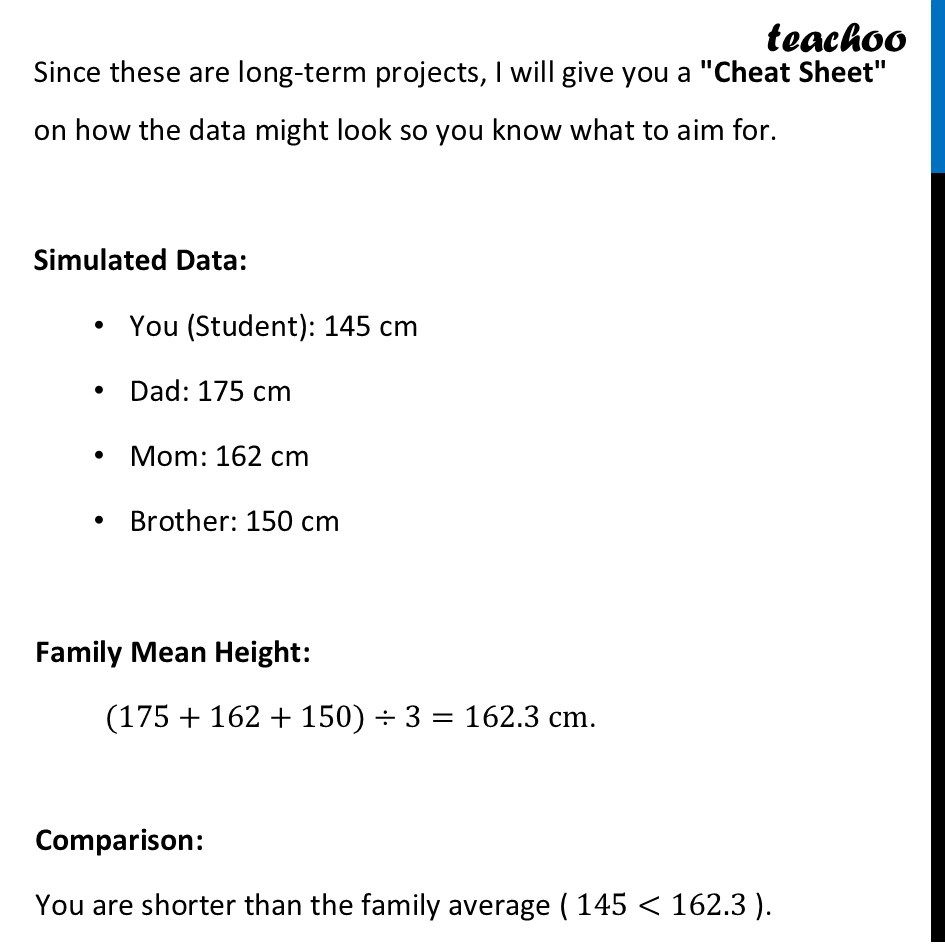
Question 13 Small-group project: Pick at least one of the following. Make groups of 8 to 10. Collect data individually as needed. Put together everyone’s data and do the appropriate analysis and visualisation. (a) Our heights vs. our family’s heights: Collect the heights of your family members. (i) Make a dot plot showing heights of just your family members. Describe its variability and central tendency. (ii) Make a double-bar graph showing each student’s height next to their family’s mean height. (iii) Look at everyone’s data and share your observations.(b) Estimating time: Check the time and close your eyes. Open them when you think 1 minute has passed (no counting). Note down after how m-any seconds you opened your eyes. Collect this data for yourself and for your family members. Repeat this activity to estimate 3 minutes. (i) Make two dot plots (for 1 minute and 3 minutes) showing estimates of just your family members. (ii) Mark these on the respective dot plots. Describe its variability and central tendency. (iii) Make a double bar graph showing each family’s mean 1 minute estimate and mean 3-minute estimate. (iv) Look at everyone’s data and share your observations. Since these are long-term projects, I will give you a "Cheat Sheet" on how the data might look so you know what to aim for. Simulated Data: You (Student): 145 cm Dad: 175 cm Mom: 162 cm Brother: 150 cm Family Mean Height: (175+162+150)÷3=162.3" " cm. Comparison: You are shorter than the family average ( 145<162.3 ). Double Bar Graph: You would draw one bar for "My Height" (145) and one bar right next to it for "Family Mean" (162.3).
