You are here
![[Class 7 Maths] Consider this data collected from a survey of a colony - Figure it out - Page 129-134](https://cdn.teachoo.com/019dcc32-4e36-4876-9719-c9b266334e03/slide119.jpg)
Last updated at August 14, 2026 by Teachoo
Transcript
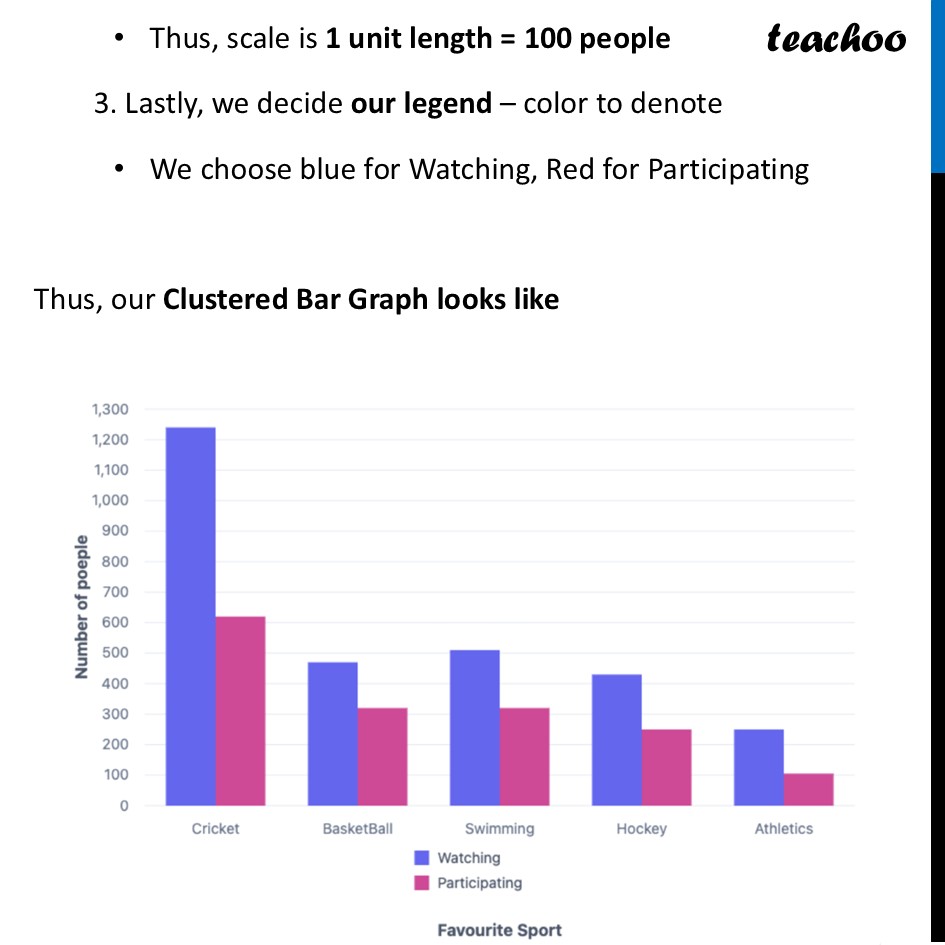
Question 4 Consider this data collected from a survey of a colony. Choose an appropriate scale and draw a double-bar graph. Write down your observations.While drawing a bar graph, we follow these steps 1. First we decide what to put in x-axis and y-axis We always use numbers in y-axis, so Number of people is in y-aixs And, Favourite sport are in y-axis 2. Then, we find out our Scale We can take multiples of 100 Thus, scale is 1 unit length = 100 people 3. Lastly, we decide our legend – color to denote We choose blue for Watching, Red for Participating Thus, our Clustered Bar Graph looks like Observations Cricket is by far the most popular sport for both watching and participating. Athletics is the least popular sport in this colony. For every sport, more people prefer watching it than participating in it.