You are here

Last updated at August 14, 2026 by Teachoo
Transcript
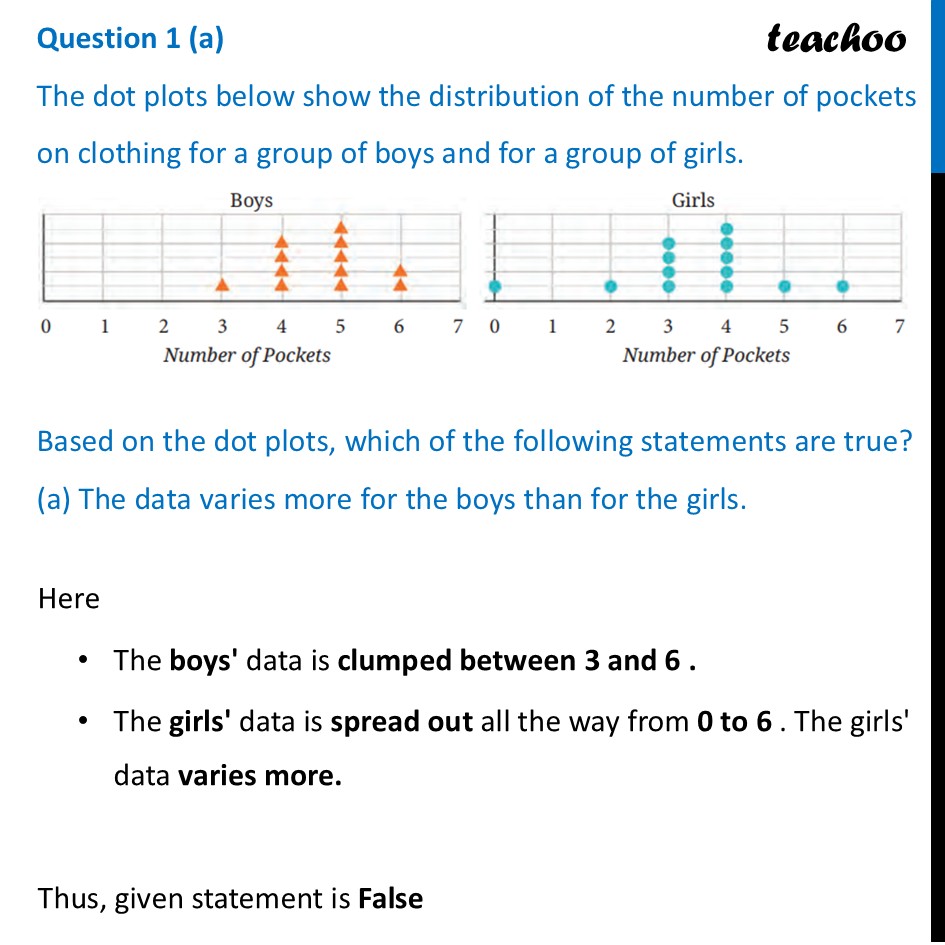
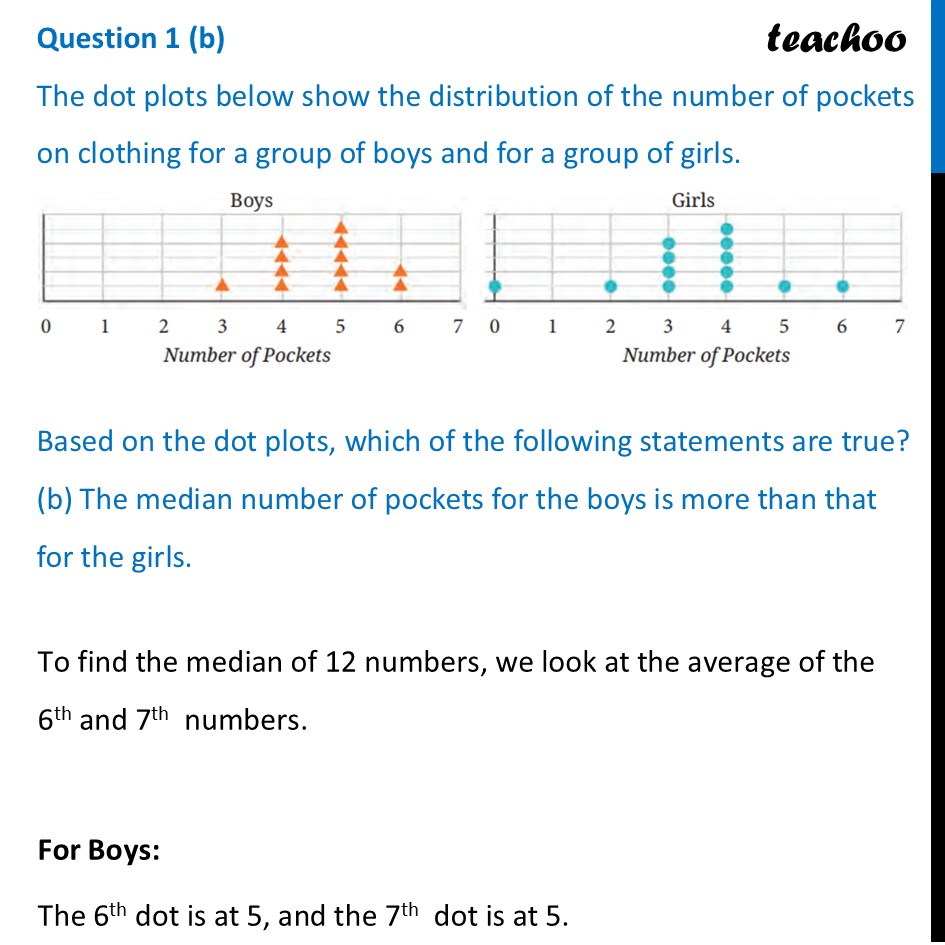
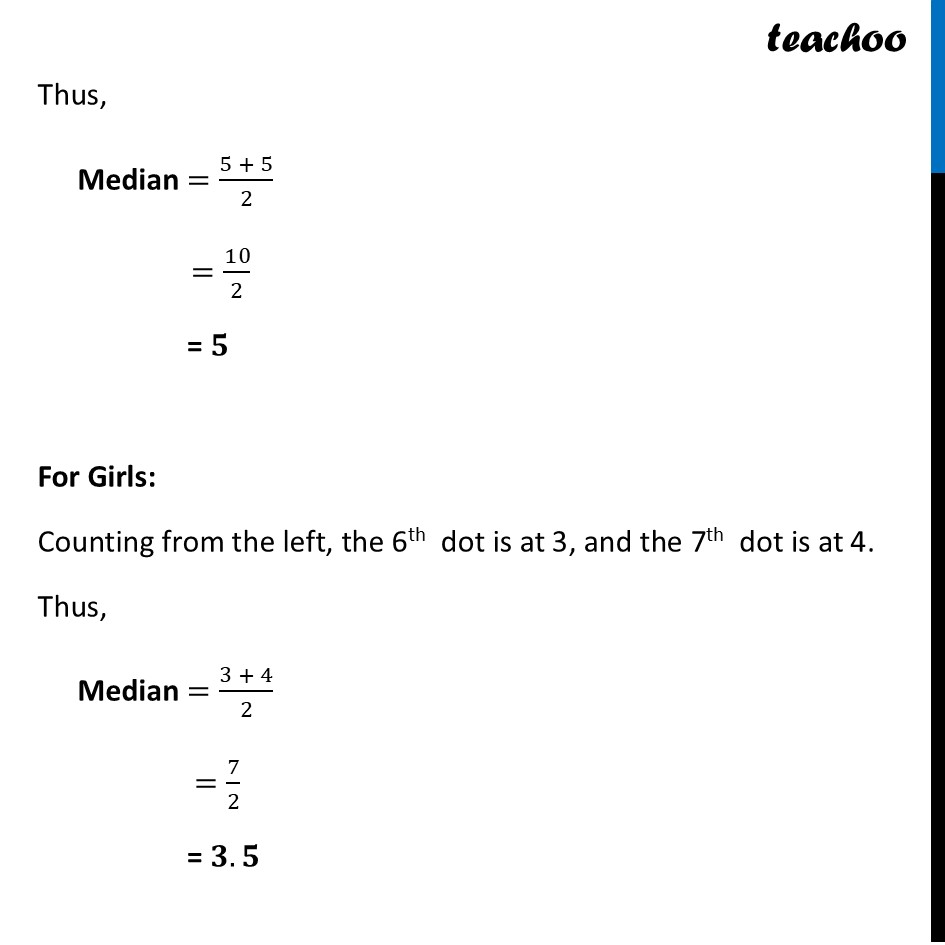
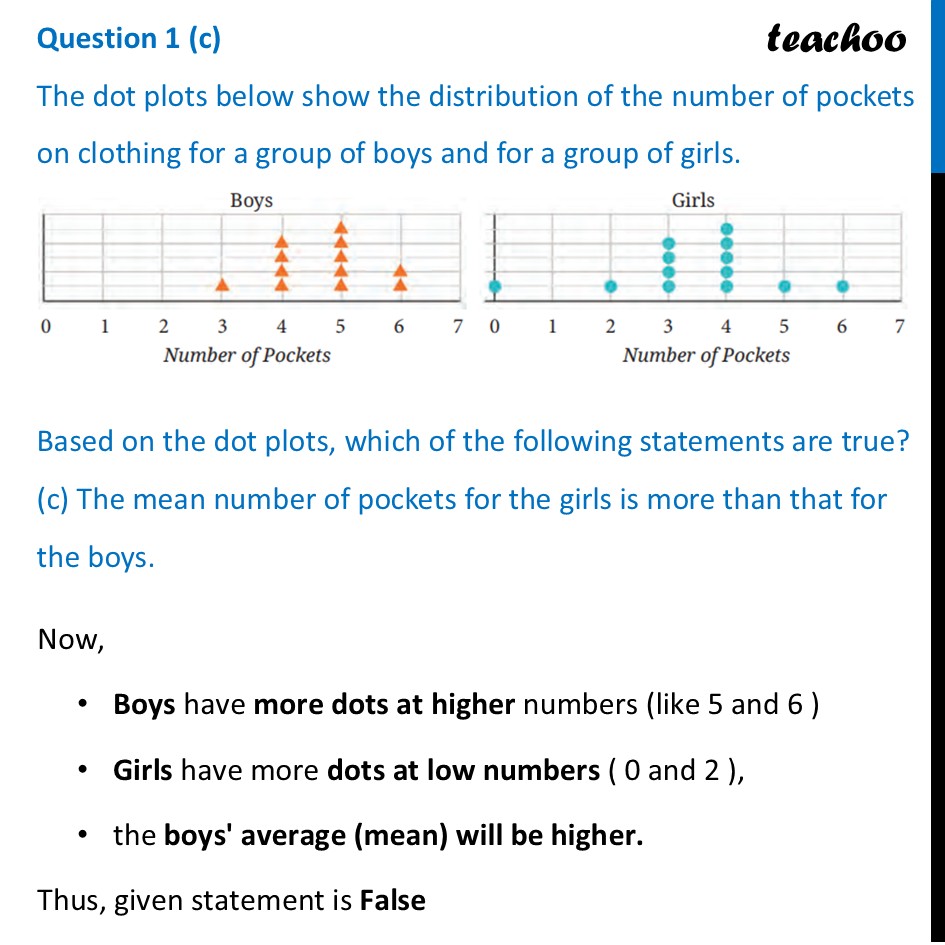
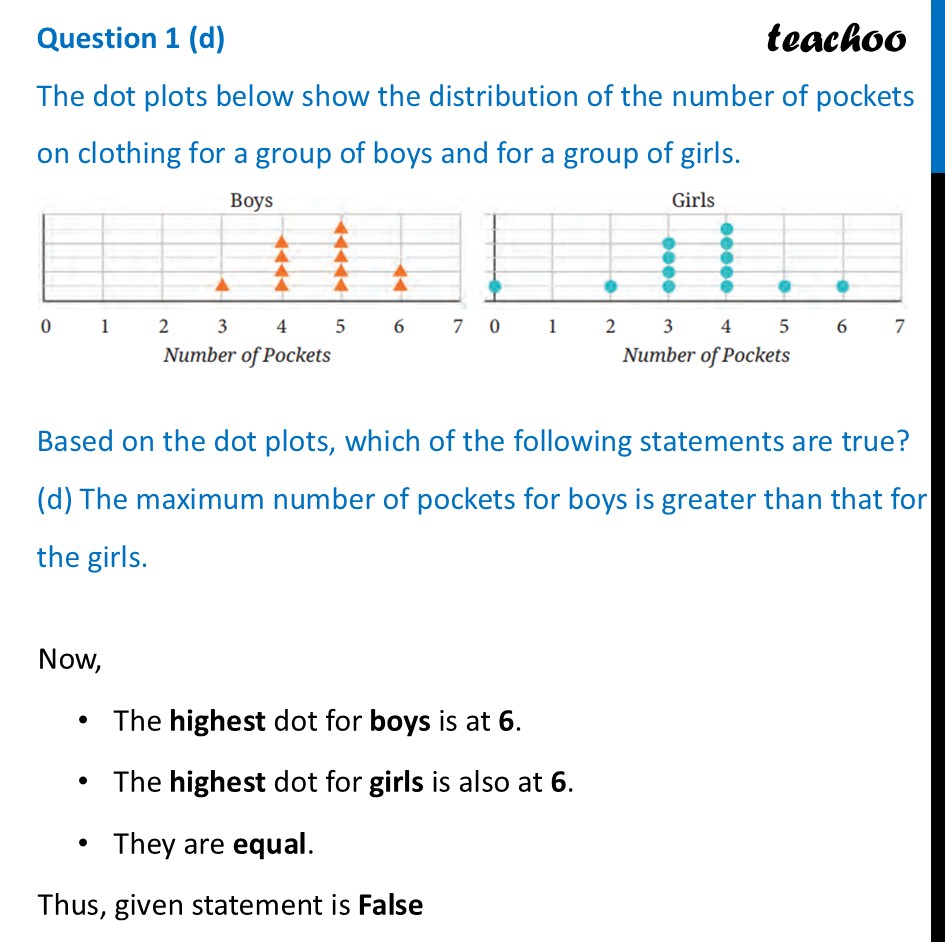
Question 1 (a) The dot plots below show the distribution of the number of pockets on clothing for a group of boys and for a group of girls. Based on the dot plots, which of the following statements are true? (a) The data varies more for the boys than for the girls.Here The boys' data is clumped between 3 and 6 . The girls' data is spread out all the way from 0 to 6 . The girls' data varies more. Thus, given statement is False Question 1 (b) The dot plots below show the distribution of the number of pockets on clothing for a group of boys and for a group of girls. Based on the dot plots, which of the following statements are true? (b) The median number of pockets for the boys is more than that for the girls.To find the median of 12 numbers, we look at the average of the 6th and 7th numbers. For Boys: The 6th dot is at 5, and the 7th dot is at 5. Thus, Median =(5 + 5)/2 =10/2 = 𝟓 For Girls: Counting from the left, the 6th dot is at 3, and the 7th dot is at 4. Thus, Median =(3 + 4)/2 =7/2 = 𝟑.𝟓 Since 5 is greater than 3.5. Thus, given statement is True Question 1 (c) The dot plots below show the distribution of the number of pockets on clothing for a group of boys and for a group of girls. Based on the dot plots, which of the following statements are true? (c) The mean number of pockets for the girls is more than that for the boys.Now, Boys have more dots at higher numbers (like 5 and 6 ) Girls have more dots at low numbers ( 0 and 2 ), the boys' average (mean) will be higher. Thus, given statement is False Question 1 (d) The dot plots below show the distribution of the number of pockets on clothing for a group of boys and for a group of girls. Based on the dot plots, which of the following statements are true? (d) The maximum number of pockets for boys is greater than that for the girls.Now, The highest dot for boys is at 6. The highest dot for girls is also at 6. They are equal. Thus, given statement is False