Last updated at February 2, 2026 by Teachoo
Transcript
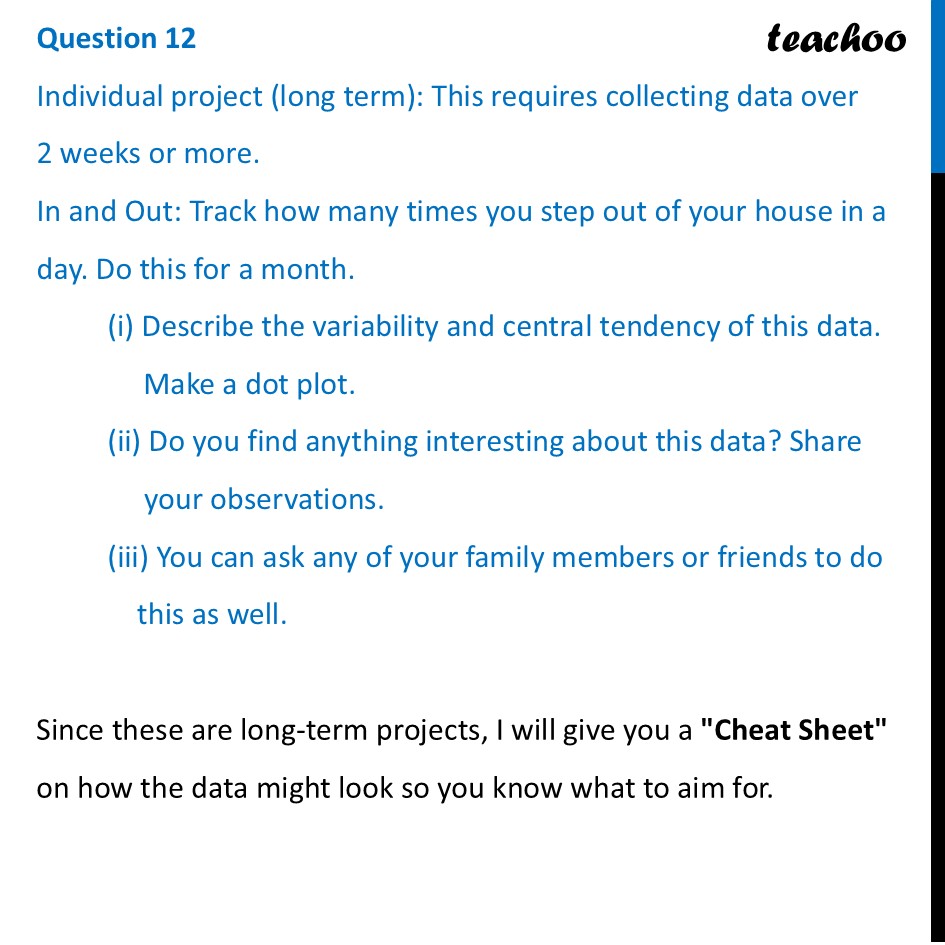
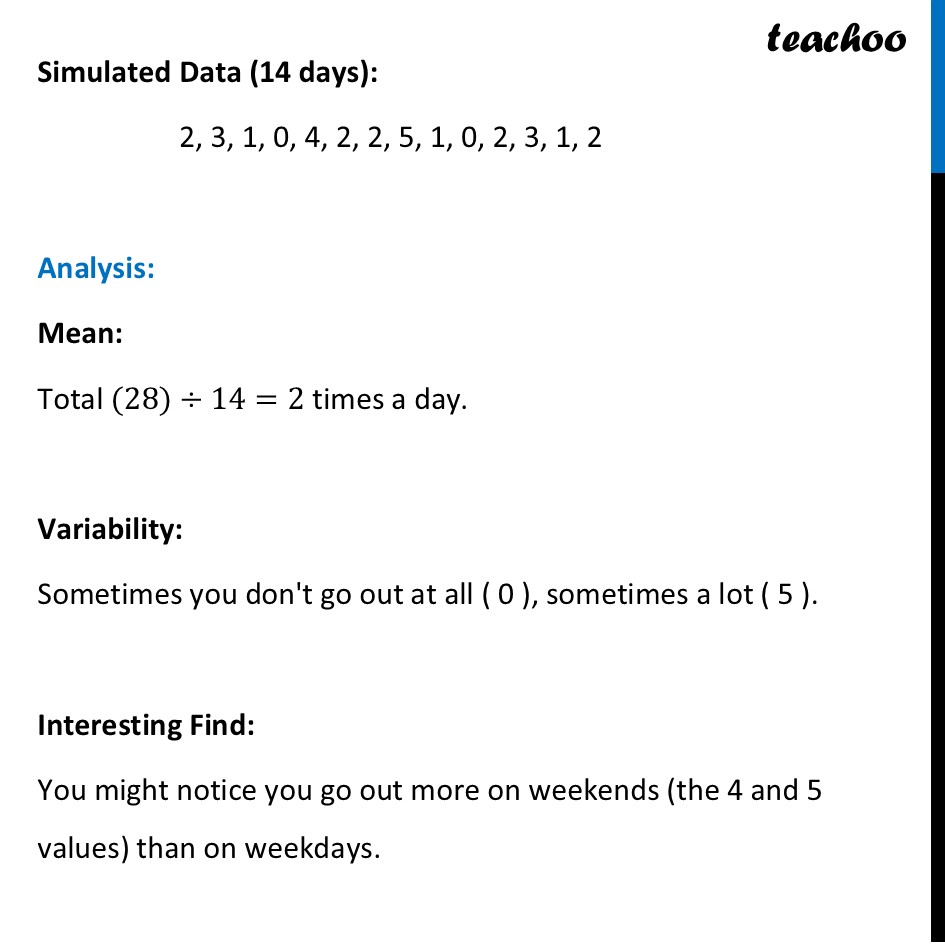
Question 12 Individual project (long term): This requires collecting data over 2 weeks or more. In and Out: Track how many times you step out of your house in a day. Do this for a month. (i) Describe the variability and central tendency of this data. Make a dot plot. (ii) Do you find anything interesting about this data? Share your observations. (iii) You can ask any of your family members or friends to do this as well. Since these are long-term projects, I will give you a "Cheat Sheet" on how the data might look so you know what to aim for. Simulated Data (14 days): 2, 3, 1, 0, 4, 2, 2, 5, 1, 0, 2, 3, 1, 2 Analysis: Mean: Total (28)÷14=2 times a day. Variability: Sometimes you don't go out at all ( 0 ), sometimes a lot ( 5 ). Interesting Find: You might notice you go out more on weekends (the 4 and 5 values) than on weekdays.
