Last updated at February 2, 2026 by Teachoo
Transcript
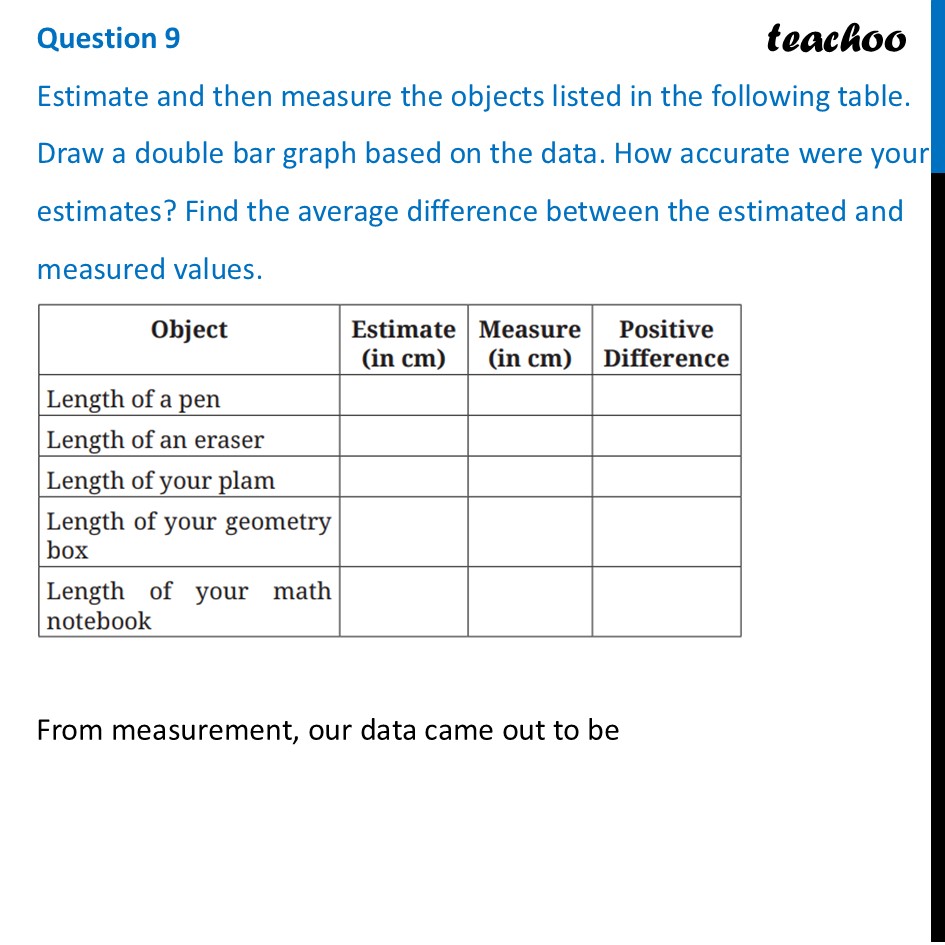
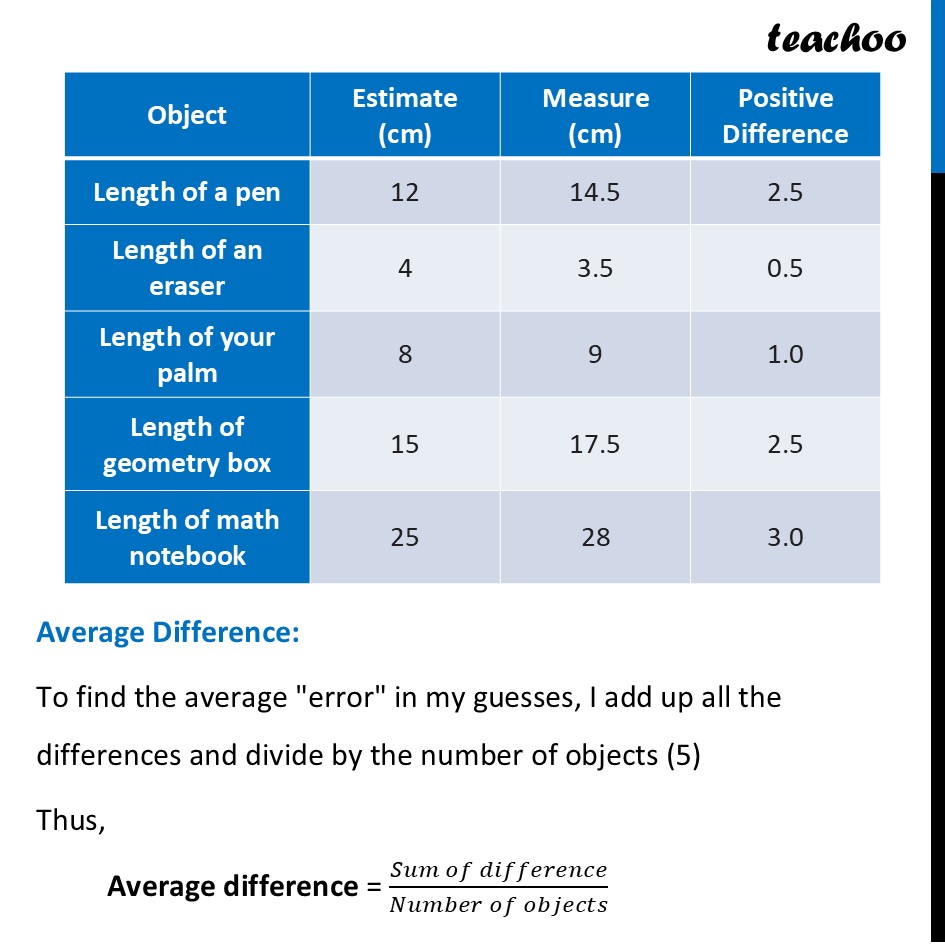
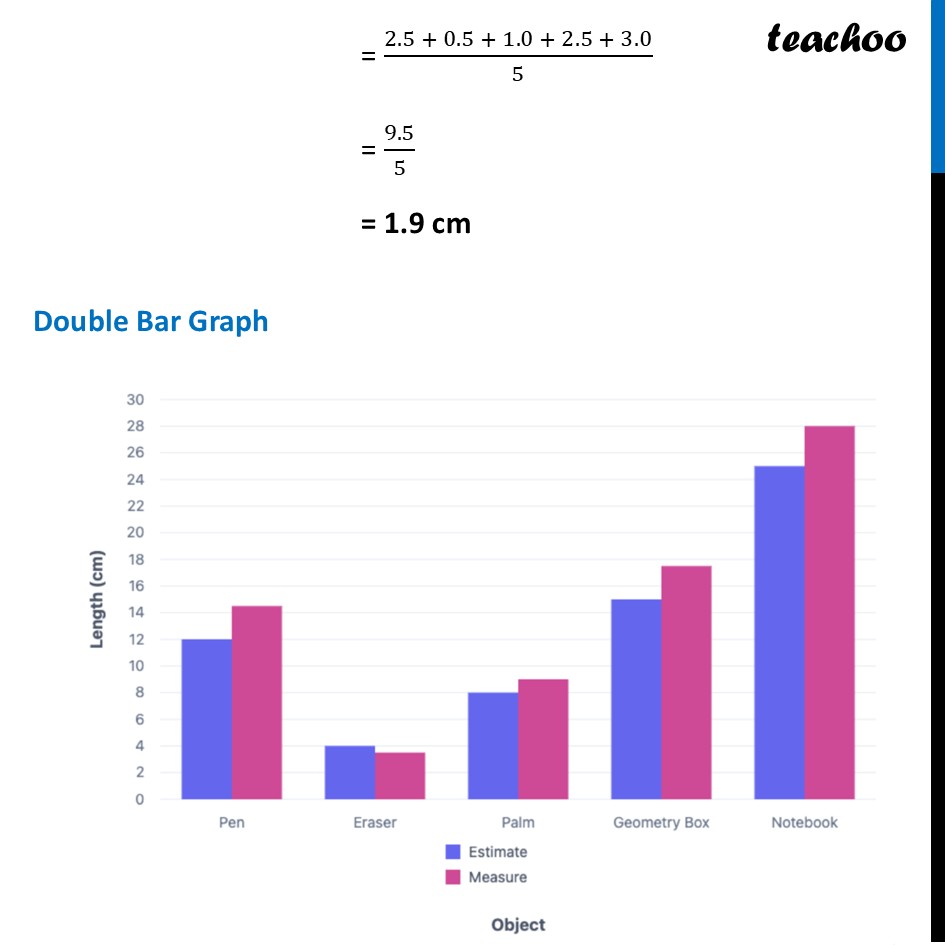
Question 9 Estimate and then measure the objects listed in the following table. Draw a double bar graph based on the data. How accurate were your estimates? Find the average difference between the estimated and measured values.From measurement, our data came out to be Average Difference: To find the average "error" in my guesses, I add up all the differences and divide by the number of objects (5) Thus, Average difference = (𝑆𝑢𝑚 𝑜𝑓 𝑑𝑖𝑓𝑓𝑒𝑟𝑒𝑛𝑐𝑒)/(𝑁𝑢𝑚𝑏𝑒𝑟 𝑜𝑓 𝑜𝑏𝑗𝑒𝑐𝑡𝑠) = (2.5 + 0.5 + 1.0 + 2.5 + 3.0)/5 = 9.5/5 = 1.9 cm Double Bar Graph
