
Last updated at December 16, 2024 by Teachoo
Transcript
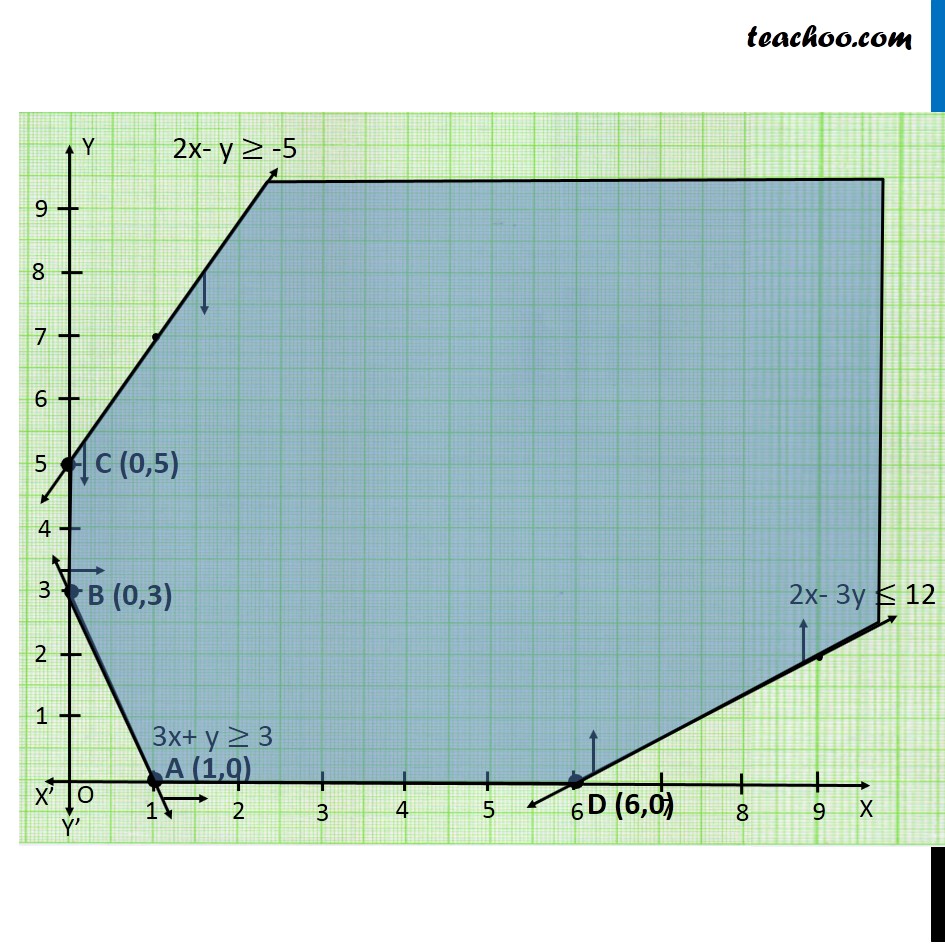
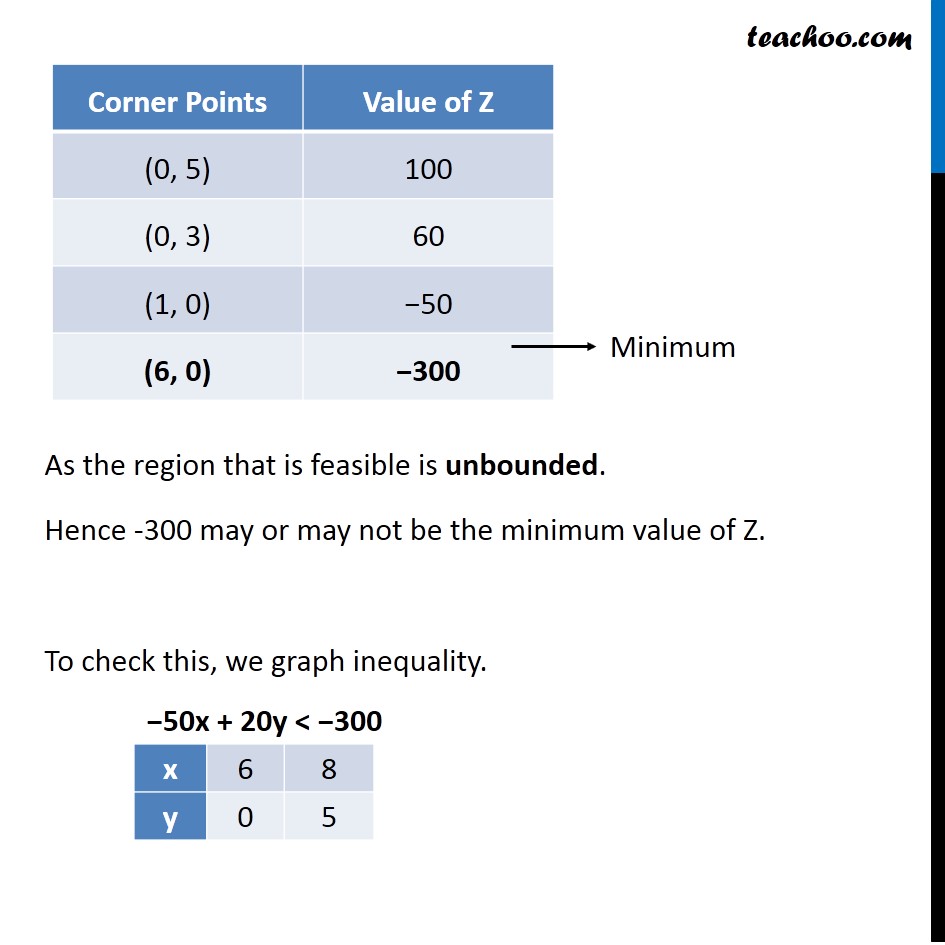
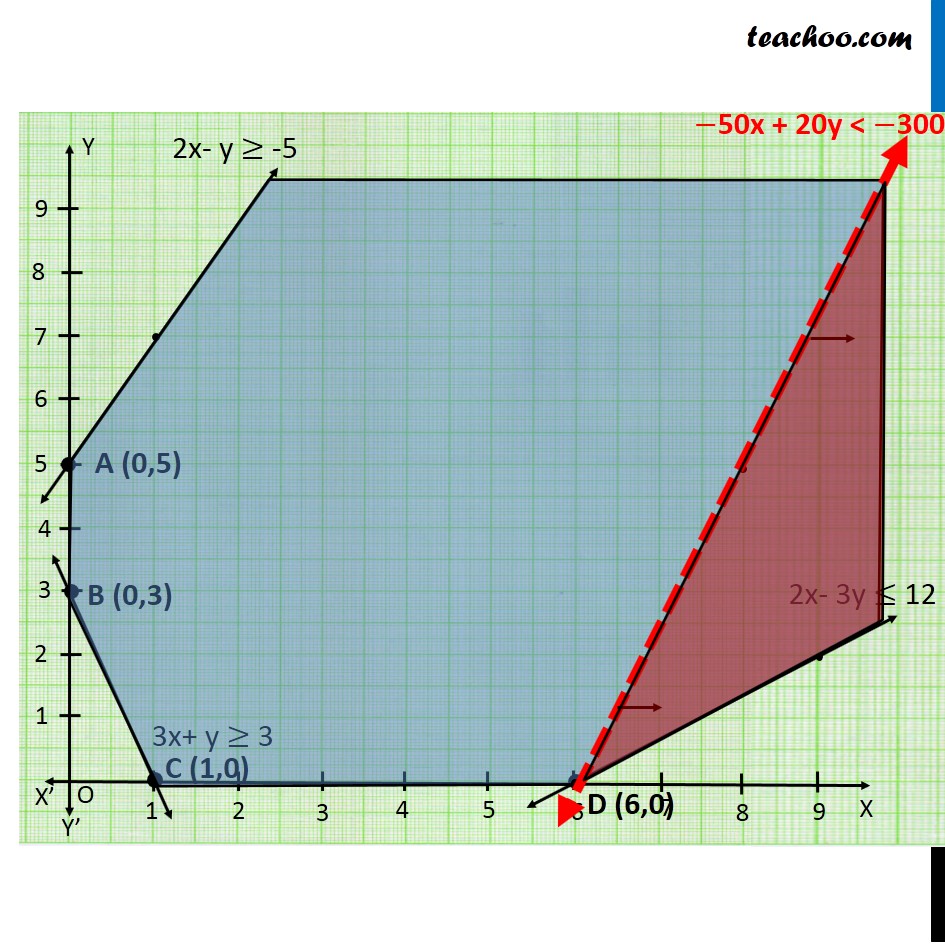
Example 4 Determine graphically the minimum value of the objective function Z = – 50x + 20y. Subject to the constraints: 2x – y ≥ – 5 3x + y ≥ 3 2x – 3y ≤ 12 x ≥ 0, y ≥ 0 Minimum Z = −50x + 20y Subject to, 2x – y ≥ – 5 3x + y ≥ 3 2x – 3y ≤ 12 x ≥ 0, y ≥ 0 As the region that is feasible is unbounded. Hence -300 may or may not be the minimum value of Z. To check this, we graph inequality. As, there are some common points between the feasible region & the inequality. Hence, 300 is not the minimum value of Z. ∴ Z has no minimum value
