
Figure it out - Page 127-132
![]()
![]()
![]()
![]()
![]()
![]()
![]()
![]()
![]()
![]()
![]()
![]()
![]()
![]()
![]()
Last updated at March 5, 2026 by Teachoo
Transcript
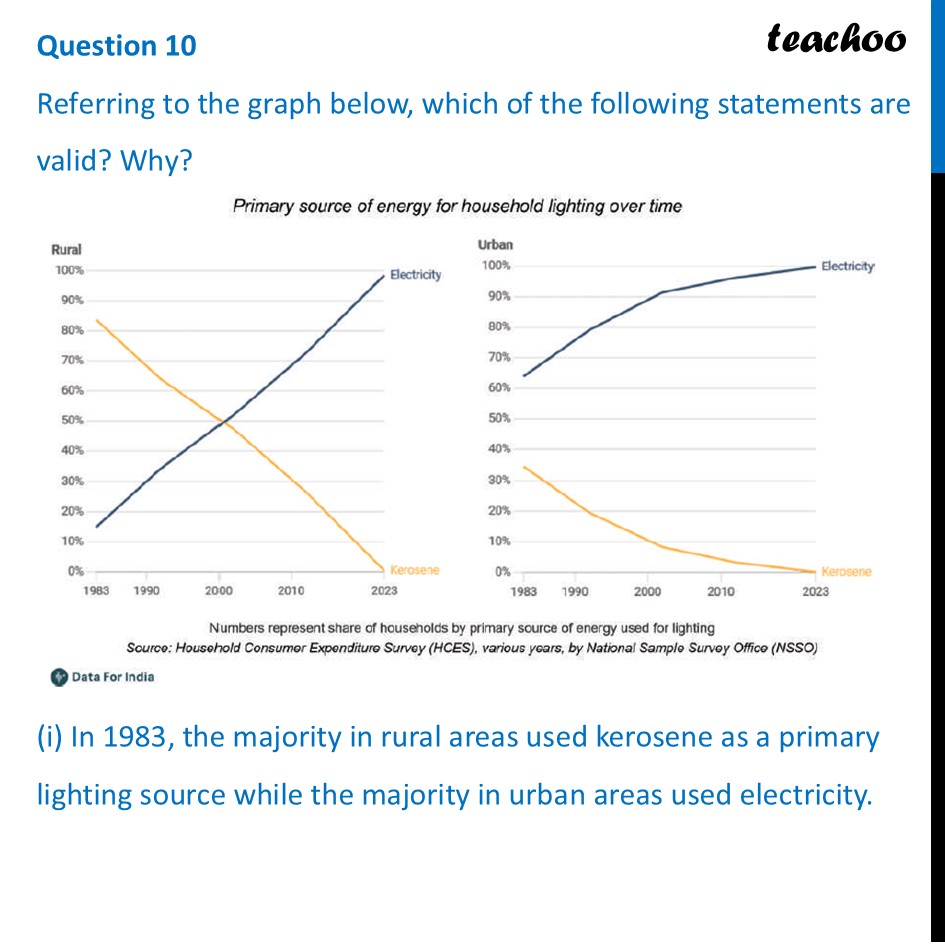
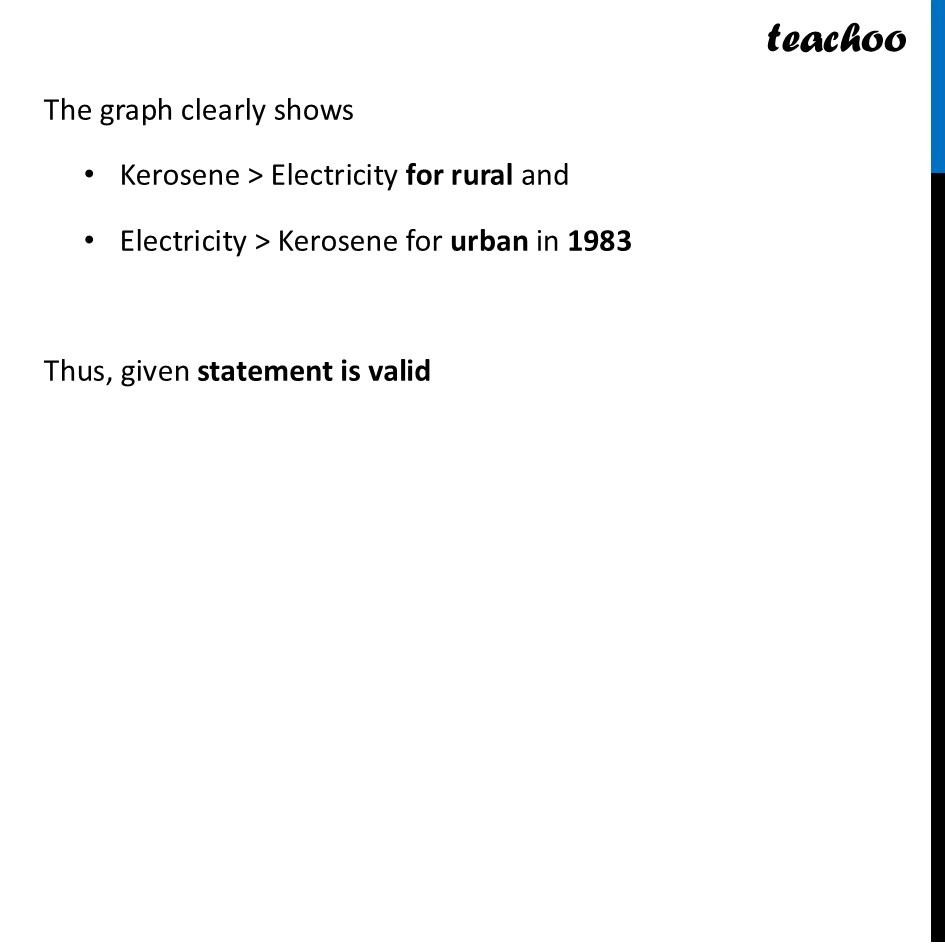
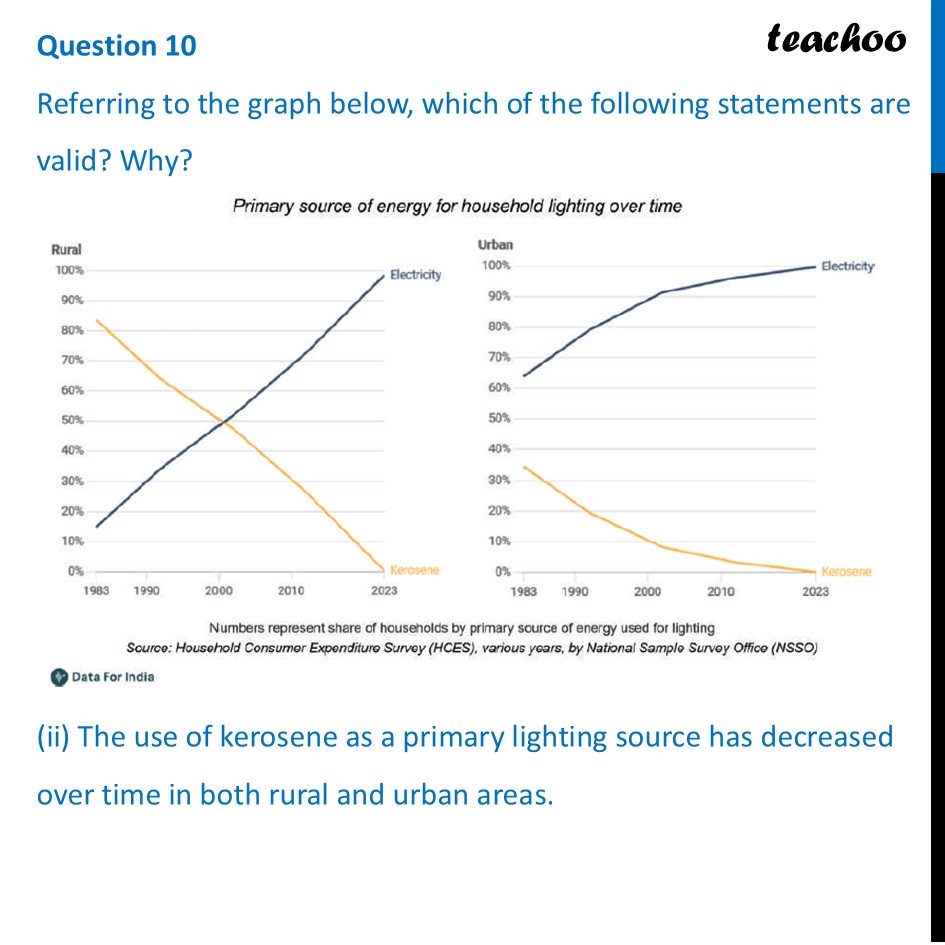
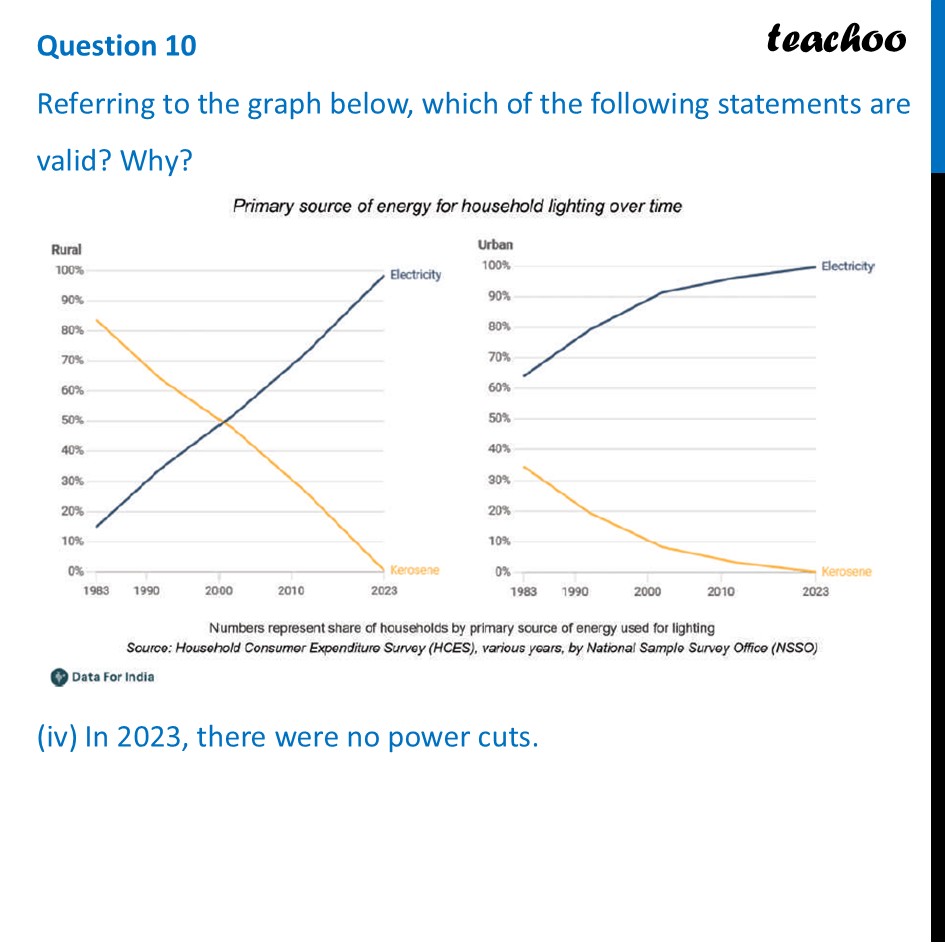
Question 10 Referring to the graph below, which of the following statements are valid? Why? (i) In 1983, the majority in rural areas used kerosene as a primary lighting source while the majority in urban areas used electricity.The graph clearly shows Kerosene > Electricity for rural and Electricity > Kerosene for urban in 1983 Thus, given statement is valid Question 10 Referring to the graph below, which of the following statements are valid? Why? (ii) The use of kerosene as a primary lighting source has decreased over time in both rural and urban areas.This is true as Both yellow lines trend downward toward zero. Thus, given statement is valid Question 10 Referring to the graph below, which of the following statements are valid? Why? (iii) In the year 2000, 10% of the urban households used electricity as a primary lighting source.In the year 2000, the Urban electricity line is way up at roughly 92%, not 10%. Thus, given statement is invalid Question 10 Referring to the graph below, which of the following statements are valid? Why? (iv) In 2023, there were no power cuts.This graph tracks which energy source is used, not whether that source is reliable. It says nothing about power cuts. Thus, given statement is invalid
