Figure it out - Page 127-132
![]()
![]()
![]()
![]()
![]()
![]()
![]()
![]()
![]()
![]()
![]()
![]()
![]()
![]()
![]()
Last updated at March 5, 2026 by Teachoo
Transcript
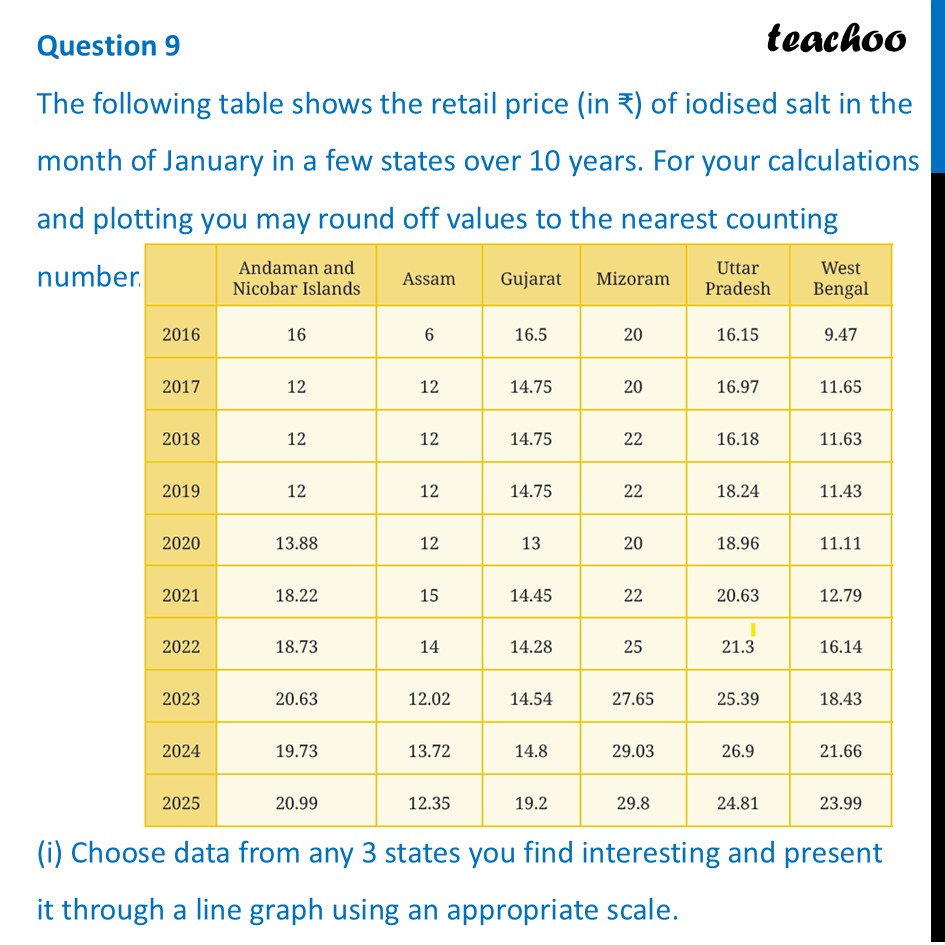
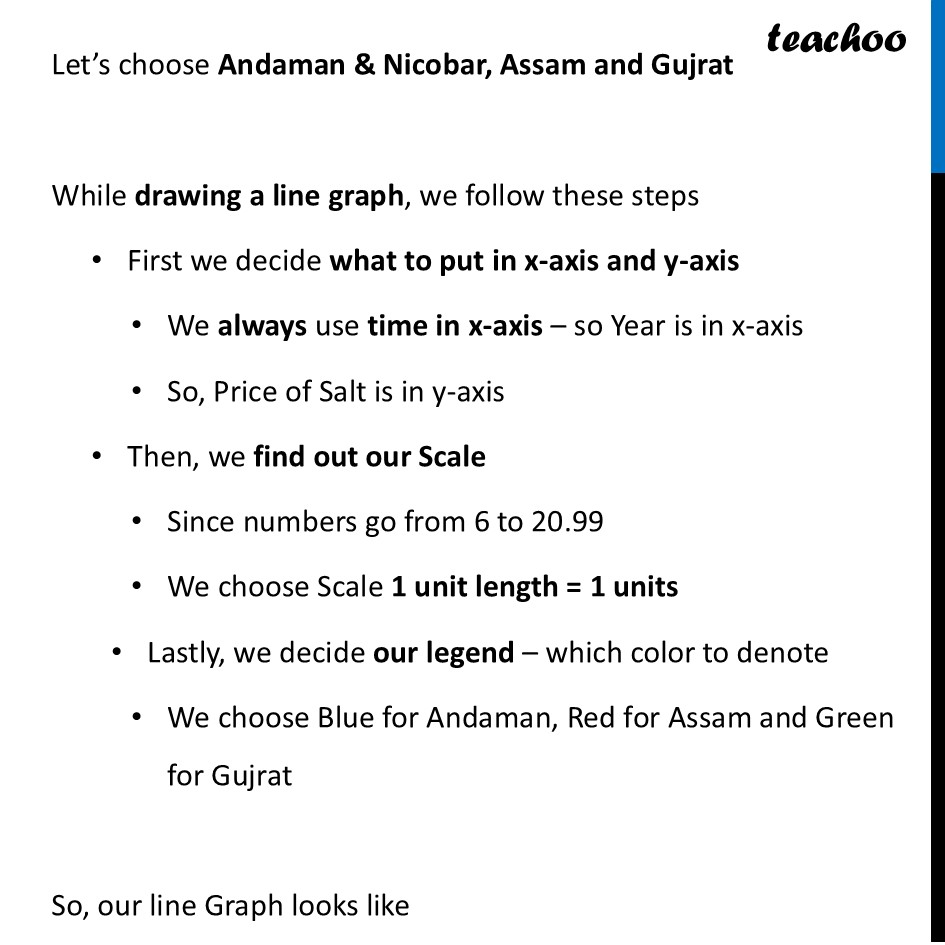
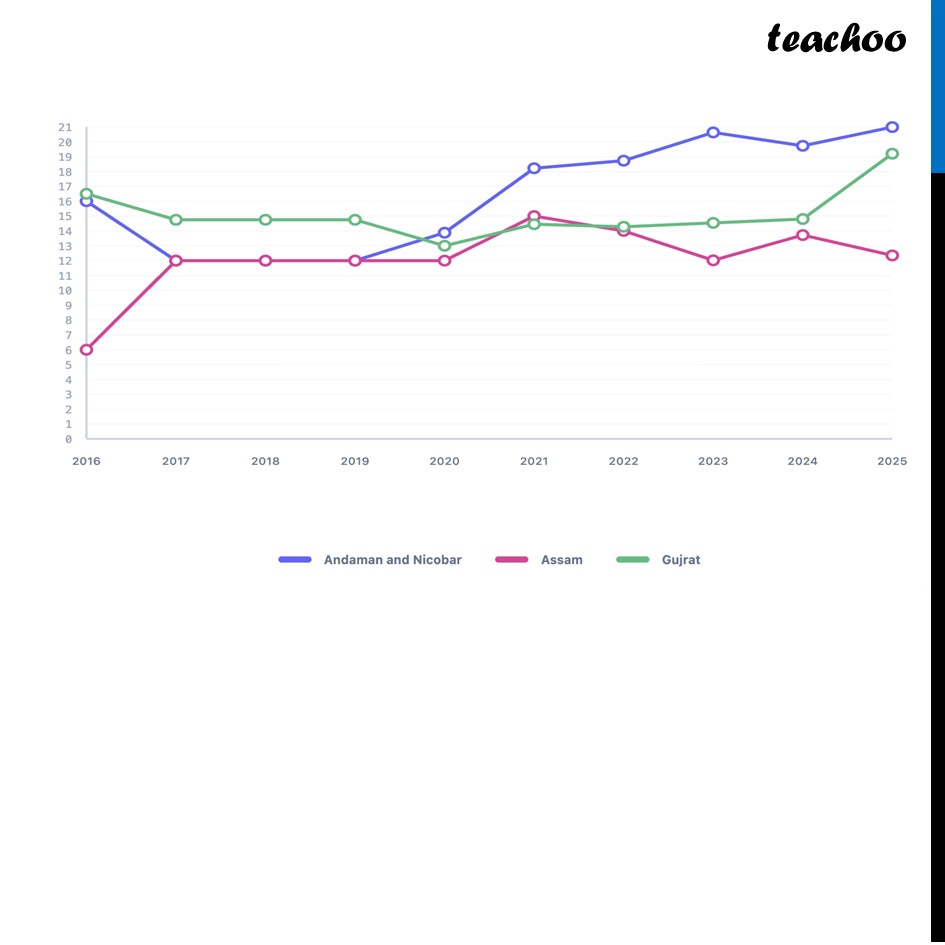
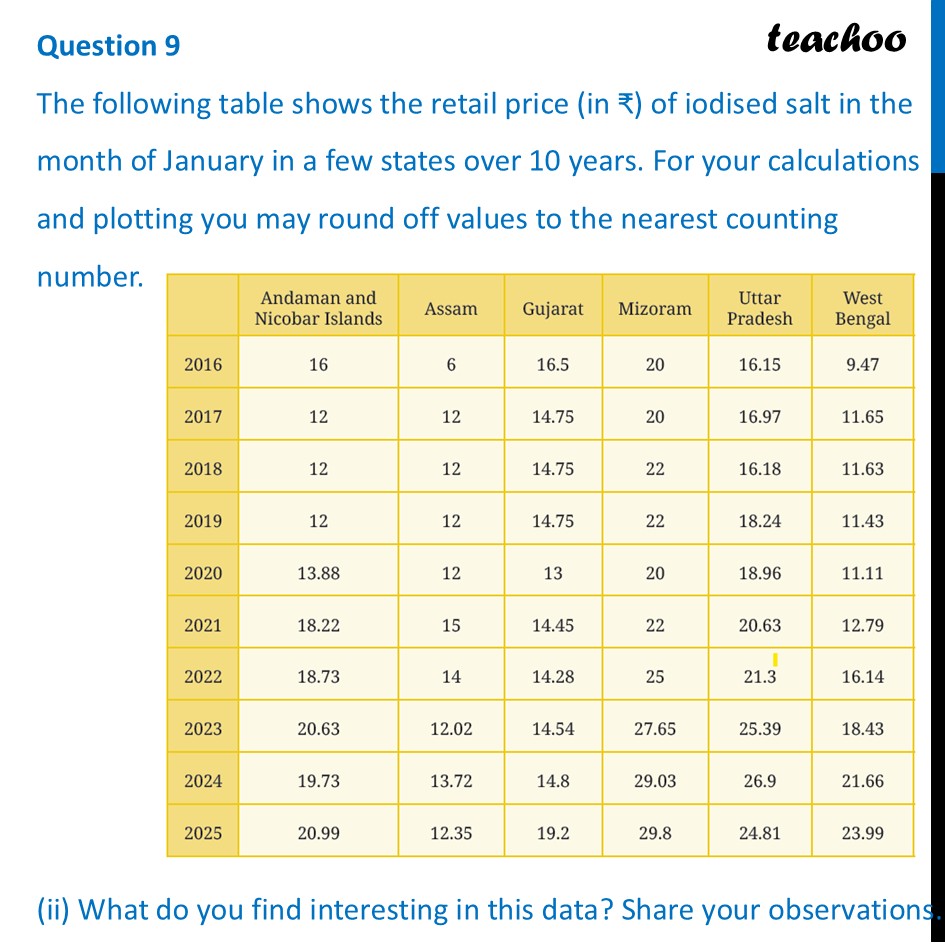
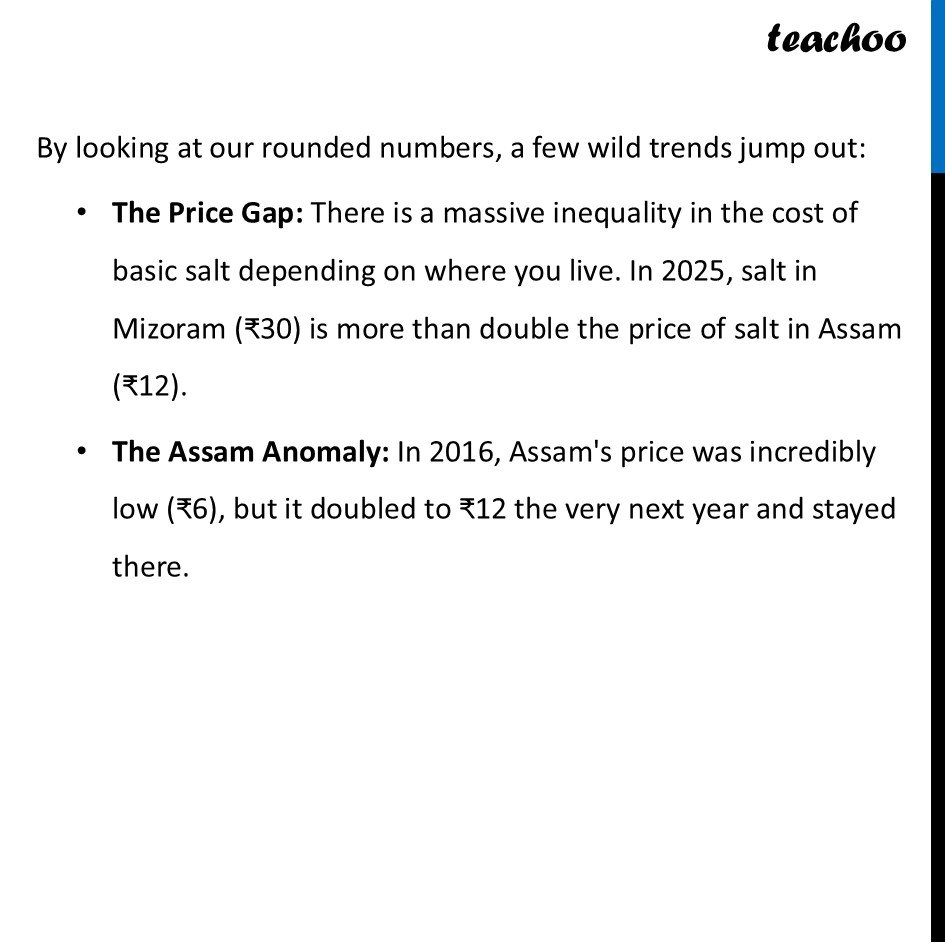
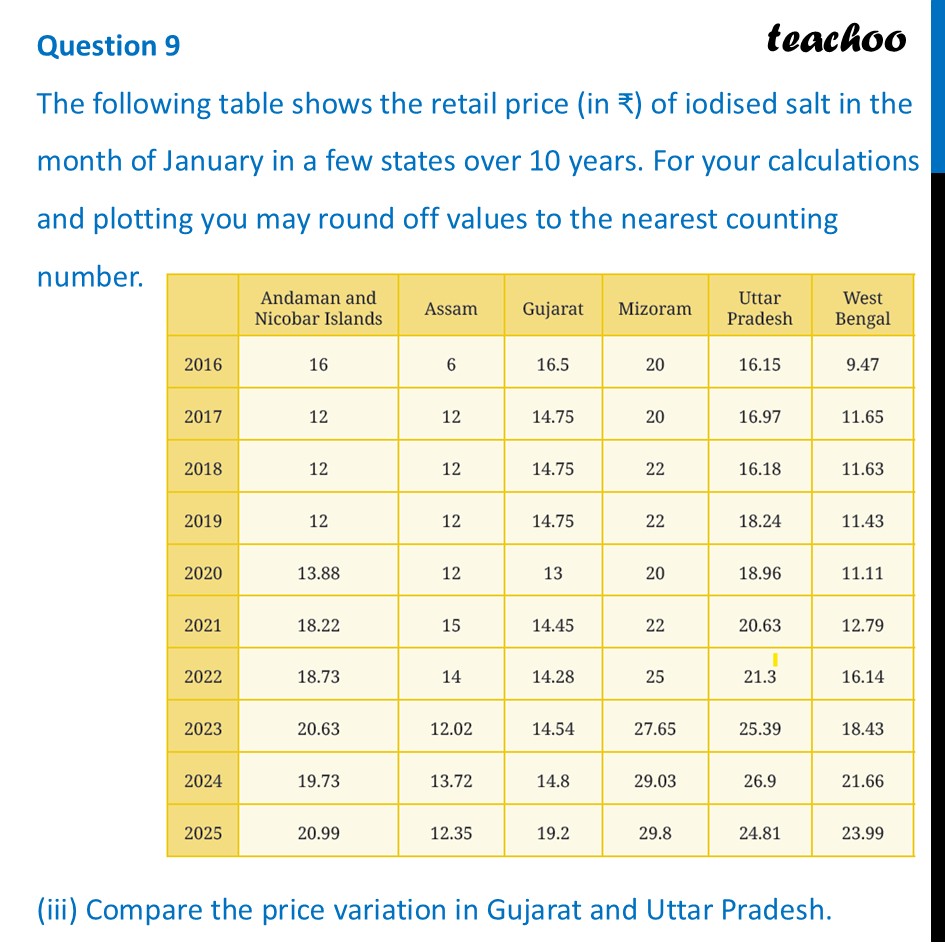
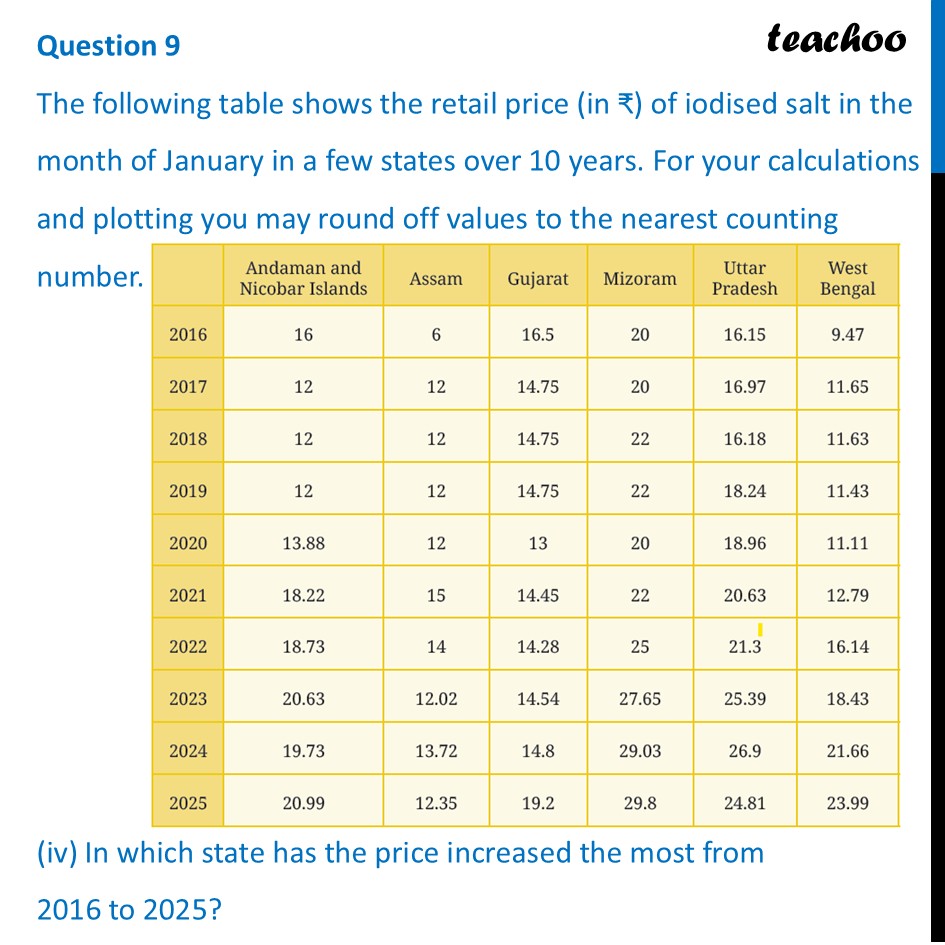
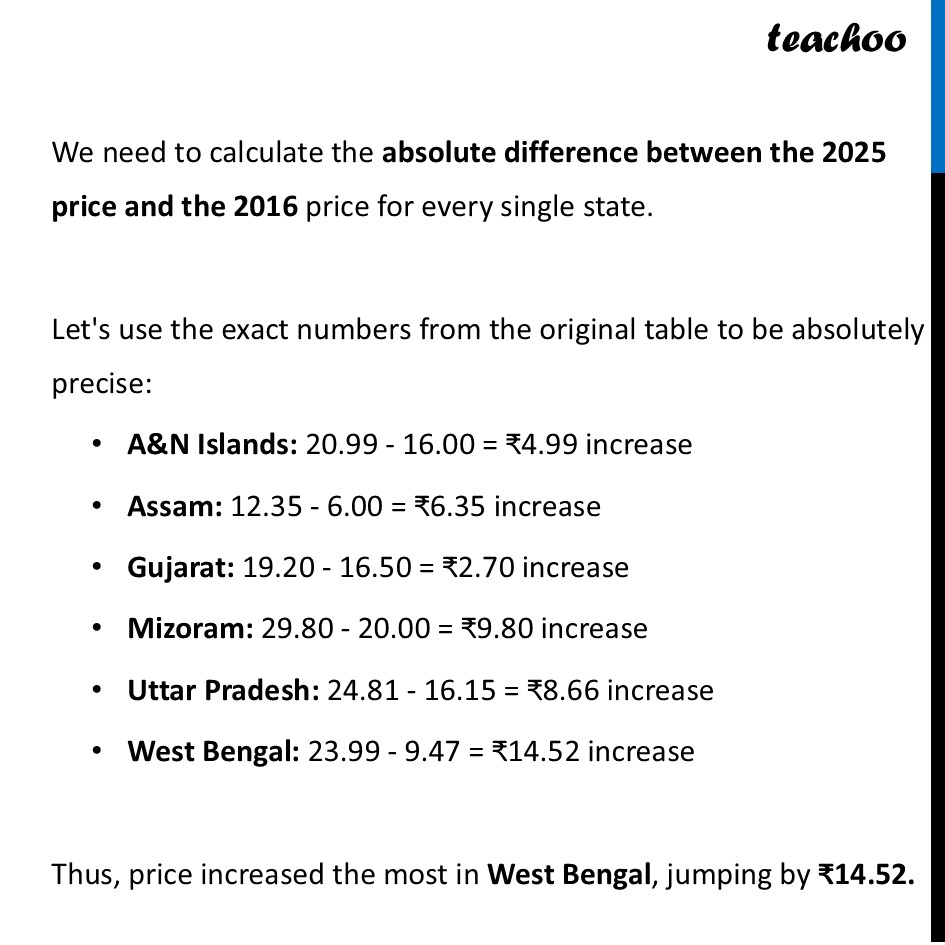
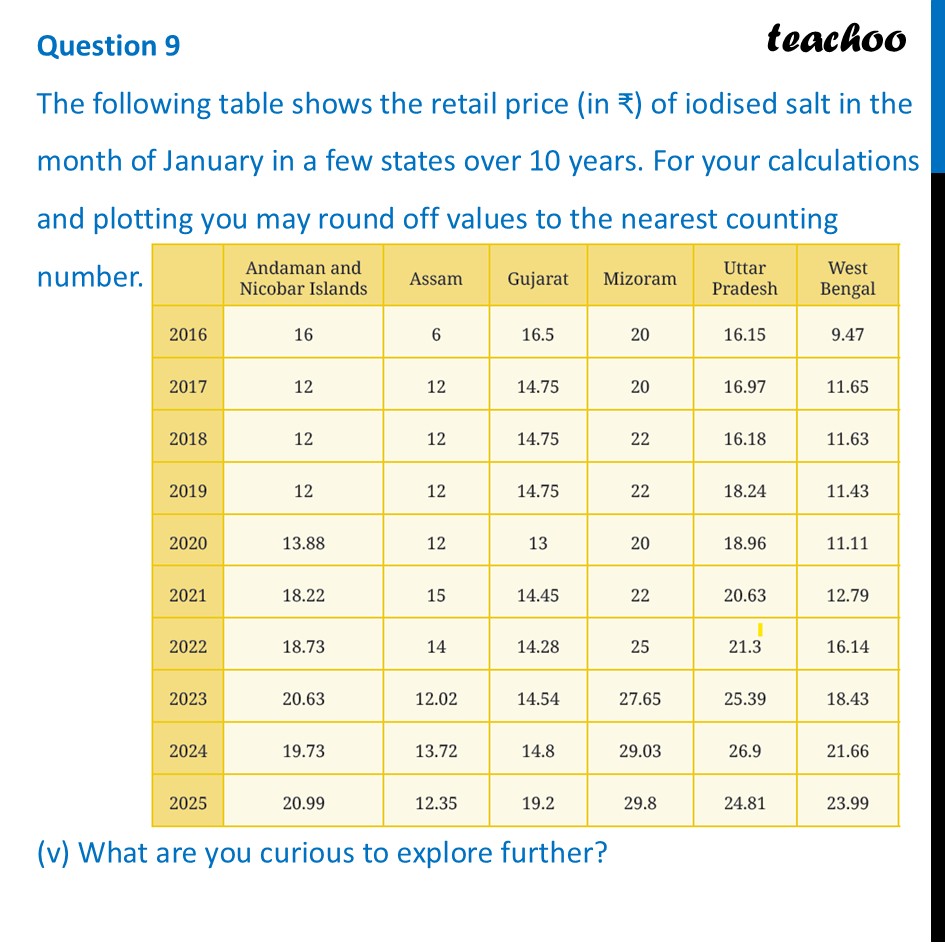
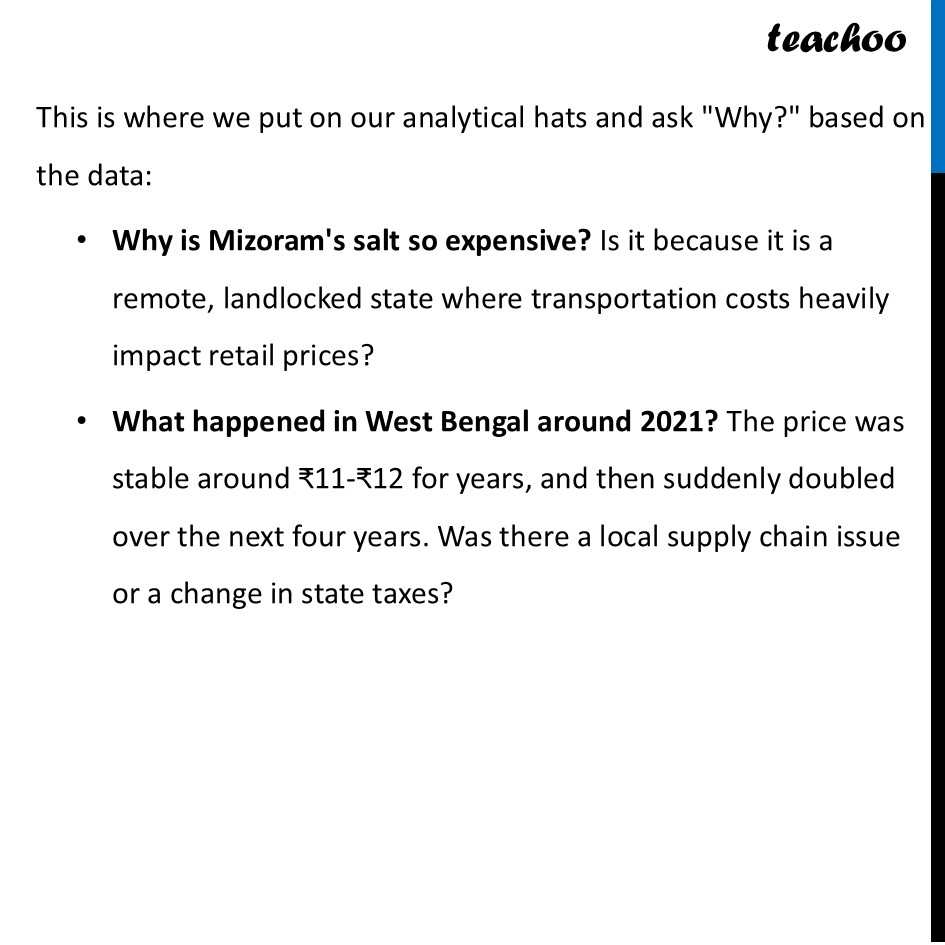
Question 9 The following table shows the retail price (in ₹) of iodised salt in the month of January in a few states over 10 years. For your calculations and plotting you may round off values to the nearest counting number. (i) Choose data from any 3 states you find interesting and present it through a line graph using an appropriate scale.Let’s choose Andaman & Nicobar, Assam and Gujrat While drawing a line graph, we follow these steps First we decide what to put in x-axis and y-axis We always use time in x-axis – so Year is in x-axis So, Price of Salt is in y-axis Then, we find out our Scale Since numbers go from 6 to 20.99 We choose Scale 1 unit length = 1 units Lastly, we decide our legend – which color to denote We choose Blue for Andaman, Red for Assam and Green for Gujrat So, our line Graph looks like Question 9 The following table shows the retail price (in ₹) of iodised salt in the month of January in a few states over 10 years. For your calculations and plotting you may round off values to the nearest counting number. (ii) What do you find interesting in this data? Share your observations.By looking at our rounded numbers, a few wild trends jump out: The Price Gap: There is a massive inequality in the cost of basic salt depending on where you live. In 2025, salt in Mizoram (₹30) is more than double the price of salt in Assam (₹12). The Assam Anomaly: In 2016, Assam's price was incredibly low (₹6), but it doubled to ₹12 the very next year and stayed there. Question 9 The following table shows the retail price (in ₹) of iodised salt in the month of January in a few states over 10 years. For your calculations and plotting you may round off values to the nearest counting number. (iii) Compare the price variation in Gujarat and Uttar Pradesh.Gujarat's price is incredibly stable, staying right around ₹14 to ₹16 for an entire decade. Uttar Pradesh shows a steep, relentless upward climb from ₹16 all the way to nearly ₹27. Question 9 The following table shows the retail price (in ₹) of iodised salt in the month of January in a few states over 10 years. For your calculations and plotting you may round off values to the nearest counting number. (iv) In which state has the price increased the most from 2016 to 2025?We need to calculate the absolute difference between the 2025 price and the 2016 price for every single state. Let's use the exact numbers from the original table to be absolutely precise: A&N Islands: 20.99 - 16.00 = ₹4.99 increase Assam: 12.35 - 6.00 = ₹6.35 increase Gujarat: 19.20 - 16.50 = ₹2.70 increase Mizoram: 29.80 - 20.00 = ₹9.80 increase Uttar Pradesh: 24.81 - 16.15 = ₹8.66 increase West Bengal: 23.99 - 9.47 = ₹14.52 increase Thus, price increased the most in West Bengal, jumping by ₹14.52. Question 9 The following table shows the retail price (in ₹) of iodised salt in the month of January in a few states over 10 years. For your calculations and plotting you may round off values to the nearest counting number. (v) What are you curious to explore further?This is where we put on our analytical hats and ask "Why?" based on the data: Why is Mizoram's salt so expensive? Is it because it is a remote, landlocked state where transportation costs heavily impact retail prices? What happened in West Bengal around 2021? The price was stable around ₹11-₹12 for years, and then suddenly doubled over the next four years. Was there a local supply chain issue or a change in state taxes?
