![Frequency Table - Definition [with Example] - Class 8 Ganita Prakash - Quick Revision](https://cdn.teachoo.com/10a2ad97-5f12-4f47-b9fd-066df783be80/slide9.jpg)
Last updated at July 16, 2026 by Teachoo
Transcript
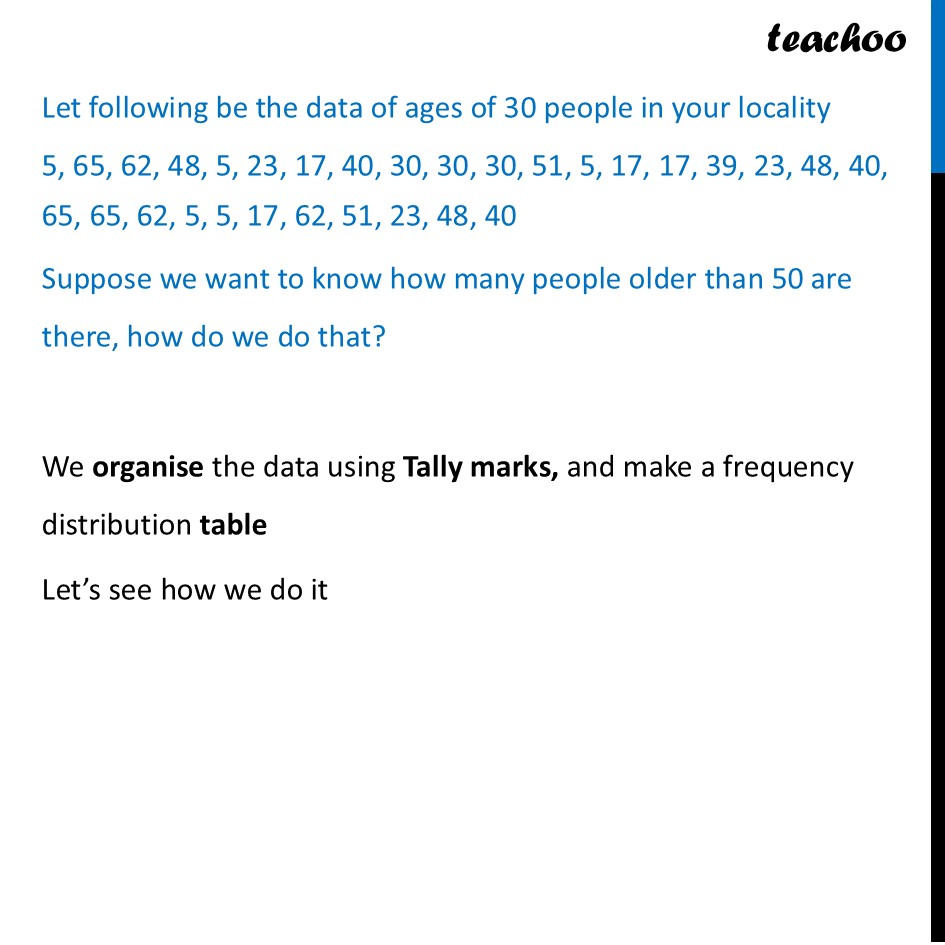
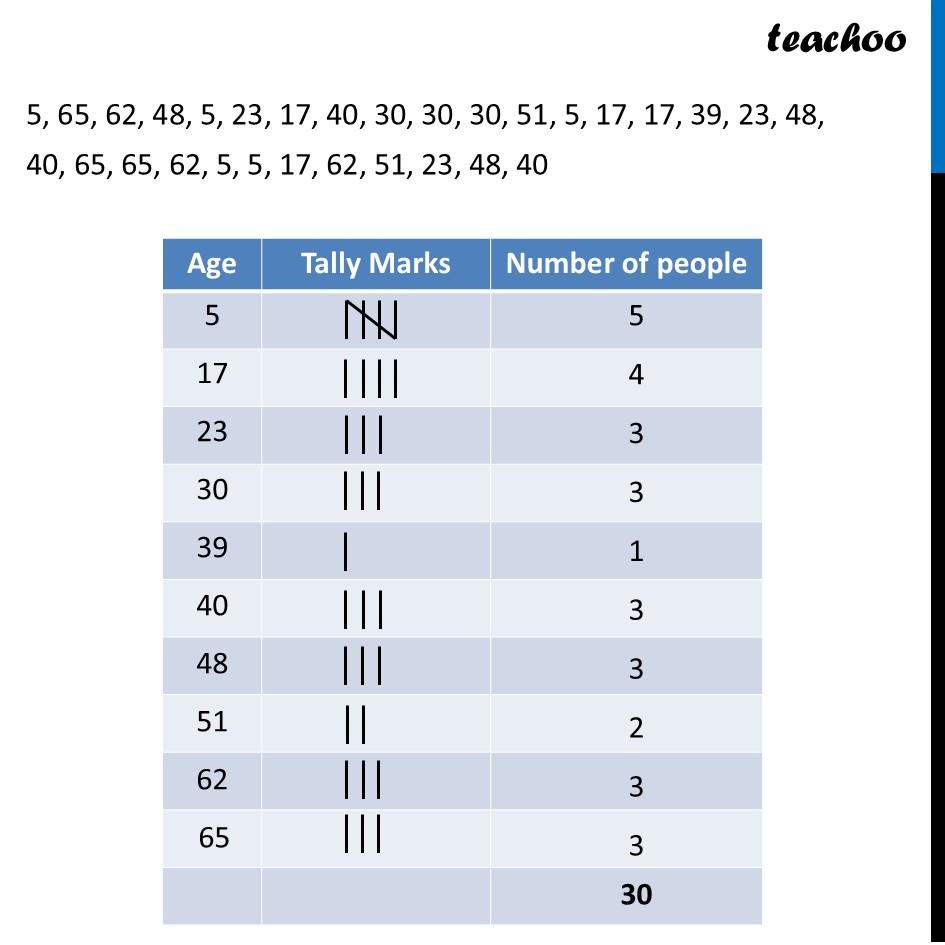
Frequency Table Frequency distribution table looks like We take an example to see how it is formed Let following be the data of ages of 30 people in your locality 5, 65, 62, 48, 5, 23, 17, 40, 30, 30, 30, 51, 5, 17, 17, 39, 23, 48, 40, 65, 65, 62, 5, 5, 17, 62, 51, 23, 48, 40 Suppose we want to know how many people older than 50 are there, how do we do that? We organise the data using Tally marks, and make a frequency distribution table Let’s see how we do it 5, 65, 62, 48, 5, 23, 17, 40, 30, 30, 30, 51, 5, 17, 17, 39, 23, 48, 40, 65, 65, 62, 5, 5, 17, 62, 51, 23, 48, 40
