Last updated at March 5, 2026 by Teachoo
Transcript
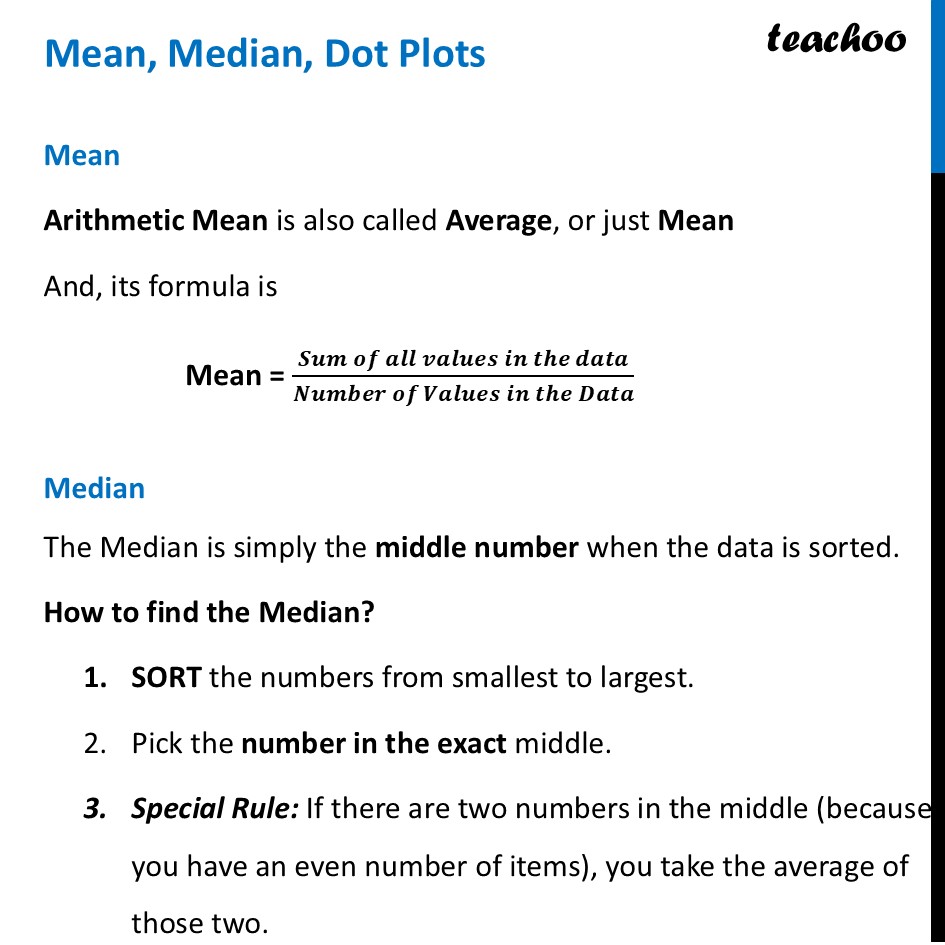
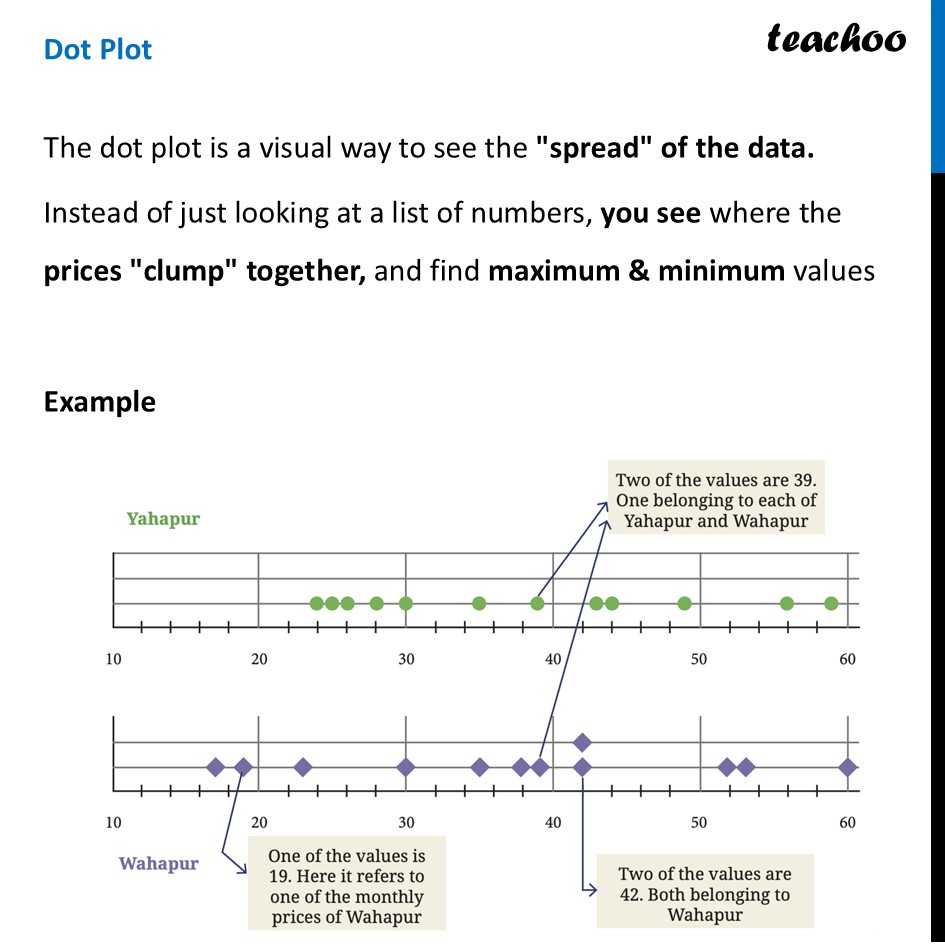
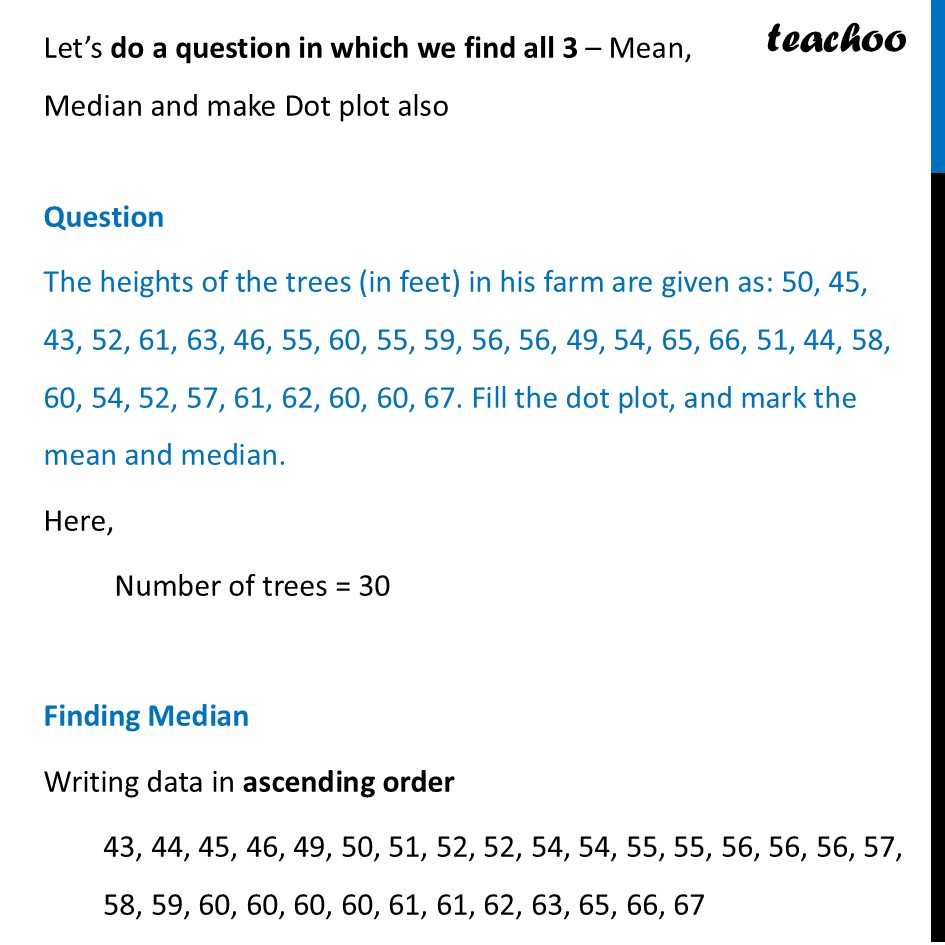
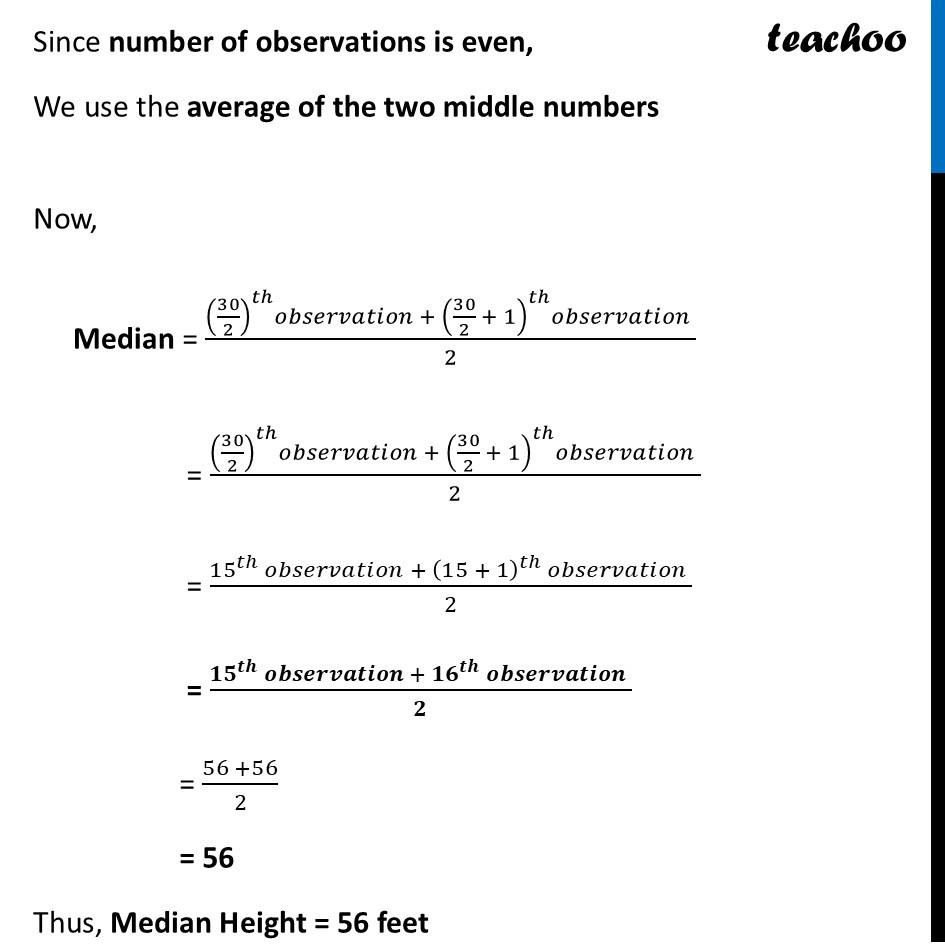
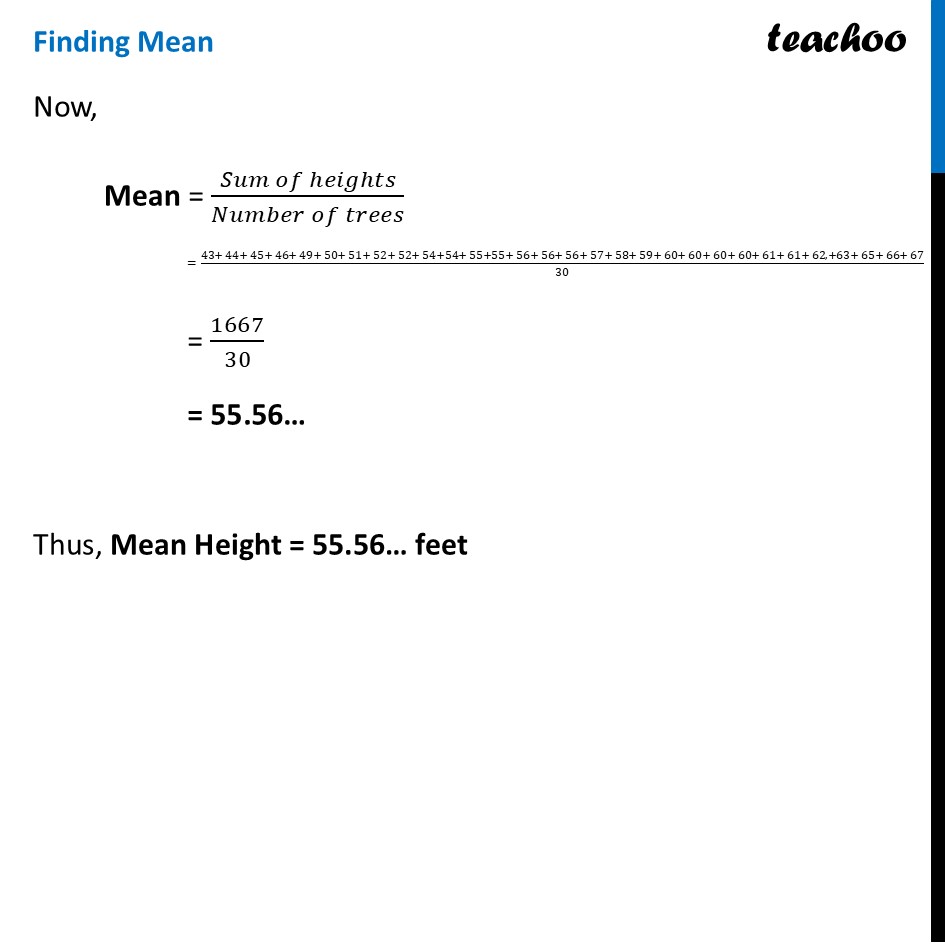
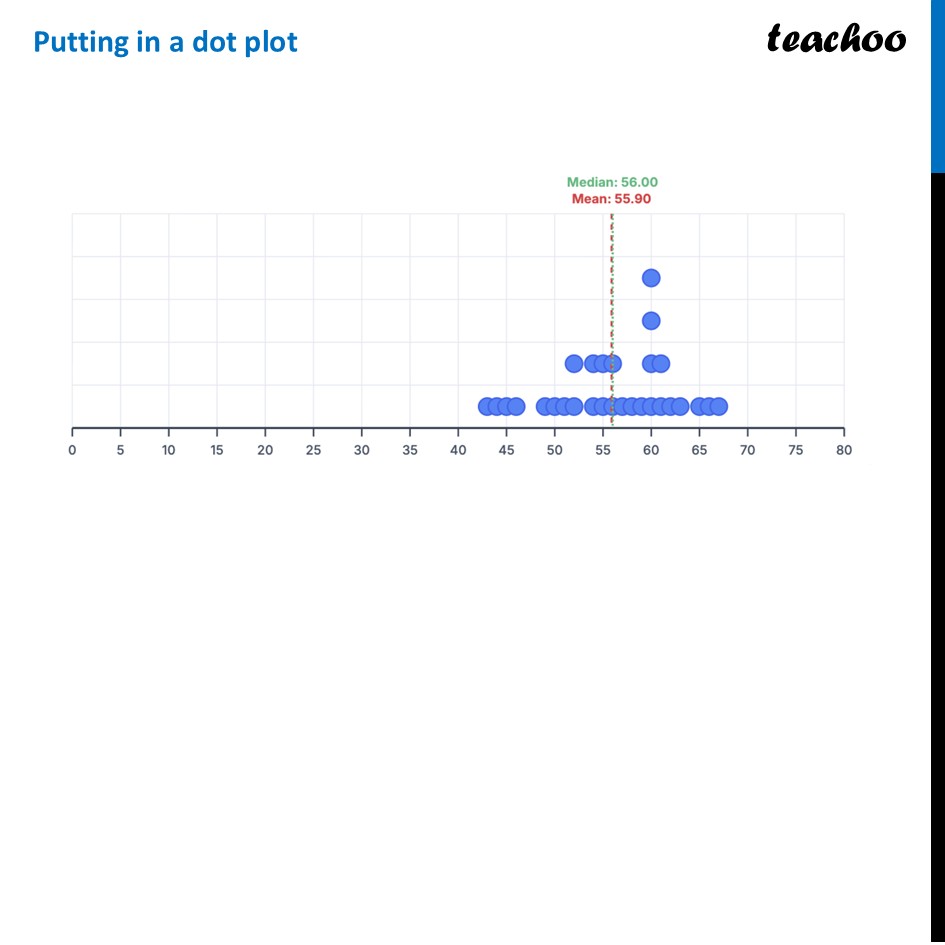
Mean, Median, Dot PlotsMean Arithmetic Mean is also called Average, or just Mean And, its formula is Mean = (𝑺𝒖𝒎 𝒐𝒇 𝒂𝒍𝒍 𝒗𝒂𝒍𝒖𝒆𝒔 𝒊𝒏 𝒕𝒉𝒆 𝒅𝒂𝒕𝒂)/(𝑵𝒖𝒎𝒃𝒆𝒓 𝒐𝒇 𝑽𝒂𝒍𝒖𝒆𝒔 𝒊𝒏 𝒕𝒉𝒆 𝑫𝒂𝒕𝒂) Median The Median is simply the middle number when the data is sorted. How to find the Median? SORT the numbers from smallest to largest. Pick the number in the exact middle. Special Rule: If there are two numbers in the middle (because you have an even number of items), you take the average of those two. Dot PlotThe dot plot is a visual way to see the "spread" of the data. Instead of just looking at a list of numbers, you see where the prices "clump" together, and find maximum & minimum values Example Let’s do a question in which we find all 3 – Mean, Median and make Dot plot also Question The heights of the trees (in feet) in his farm are given as: 50, 45, 43, 52, 61, 63, 46, 55, 60, 55, 59, 56, 56, 49, 54, 65, 66, 51, 44, 58, 60, 54, 52, 57, 61, 62, 60, 60, 67. Fill the dot plot, and mark the mean and median. Here, Number of trees = 30 Finding Median Writing data in ascending order 43, 44, 45, 46, 49, 50, 51, 52, 52, 54, 54, 55, 55, 56, 56, 56, 57, 58, 59, 60, 60, 60, 60, 61, 61, 62, 63, 65, 66, 67 Since number of observations is even, We use the average of the two middle numbers Now, Since number of observations is even, We use the average of the two middle numbers Now, Median = ((30/2)^𝑡ℎ 𝑜𝑏𝑠𝑒𝑟𝑣𝑎𝑡𝑖𝑜𝑛 + (30/2 + 1)^𝑡ℎ 𝑜𝑏𝑠𝑒𝑟𝑣𝑎𝑡𝑖𝑜𝑛 )/2 = ((30/2)^𝑡ℎ 𝑜𝑏𝑠𝑒𝑟𝑣𝑎𝑡𝑖𝑜𝑛 + (30/2 + 1)^𝑡ℎ 𝑜𝑏𝑠𝑒𝑟𝑣𝑎𝑡𝑖𝑜𝑛 )/2 = (15^𝑡ℎ 𝑜𝑏𝑠𝑒𝑟𝑣𝑎𝑡𝑖𝑜𝑛 + (15 + 1)^𝑡ℎ 𝑜𝑏𝑠𝑒𝑟𝑣𝑎𝑡𝑖𝑜𝑛 )/2 = (〖𝟏𝟓〗^𝒕𝒉 𝒐𝒃𝒔𝒆𝒓𝒗𝒂𝒕𝒊𝒐𝒏 + 〖𝟏𝟔〗^𝒕𝒉 𝒐𝒃𝒔𝒆𝒓𝒗𝒂𝒕𝒊𝒐𝒏 )/𝟐 = (56 +56)/2 = 56 Thus, Median Height = 56 feet Finding Mean Now, Mean = (𝑆𝑢𝑚 𝑜𝑓 ℎ𝑒𝑖𝑔ℎ𝑡𝑠)/(𝑁𝑢𝑚𝑏𝑒𝑟 𝑜𝑓 𝑡𝑟𝑒𝑒𝑠) = (43+ 44+ 45+ 46+ 49+ 50+ 51+ 52+ 52+ 54+54+ 55+55+ 56+ 56+ 56+ 57+ 58+ 59+ 60+ 60+ 60+ 60+ 61+ 61+ 62,+63+ 65+ 66+ 67)/30 = 1667/30 = 55.56… Thus, Mean Height = 55.56… feet Putting in a dot plot Now, we need to answer some questions Quicker way to find the Mean? Instead of adding huge numbers, you can guess an average (like 55). Then see how much each number is above or below 55, add those small differences up, and adjust your guess. This is called the "Assumed Mean Method." How many trees are shorter than average? The average is 𝟓𝟓.𝟓𝟕. Looking at our sorted list, count how many numbers are less than 55.57 . (Numbers: 43,…,55,55 ) Thus, there are 13 trees shorter than the average height.
