Draw a pie chart based on the following information about viewers᾿ - Figure it out - Page 62

part 2 - Question 2 - Figure it out - Page 62 - Chapter 3 Class 8 - Proportional Reasoning-2 (Ganita Prakash II) - Class 8 (Ganita Prakash - 1, 2 & Old NCERT)
part 3 - Question 2 - Figure it out - Page 62 - Chapter 3 Class 8 - Proportional Reasoning-2 (Ganita Prakash II) - Class 8 (Ganita Prakash - 1, 2 & Old NCERT) part 4 - Question 2 - Figure it out - Page 62 - Chapter 3 Class 8 - Proportional Reasoning-2 (Ganita Prakash II) - Class 8 (Ganita Prakash - 1, 2 & Old NCERT) part 5 - Question 2 - Figure it out - Page 62 - Chapter 3 Class 8 - Proportional Reasoning-2 (Ganita Prakash II) - Class 8 (Ganita Prakash - 1, 2 & Old NCERT) part 6 - Question 2 - Figure it out - Page 62 - Chapter 3 Class 8 - Proportional Reasoning-2 (Ganita Prakash II) - Class 8 (Ganita Prakash - 1, 2 & Old NCERT)

Remove Ads Share on WhatsApp

Transcript

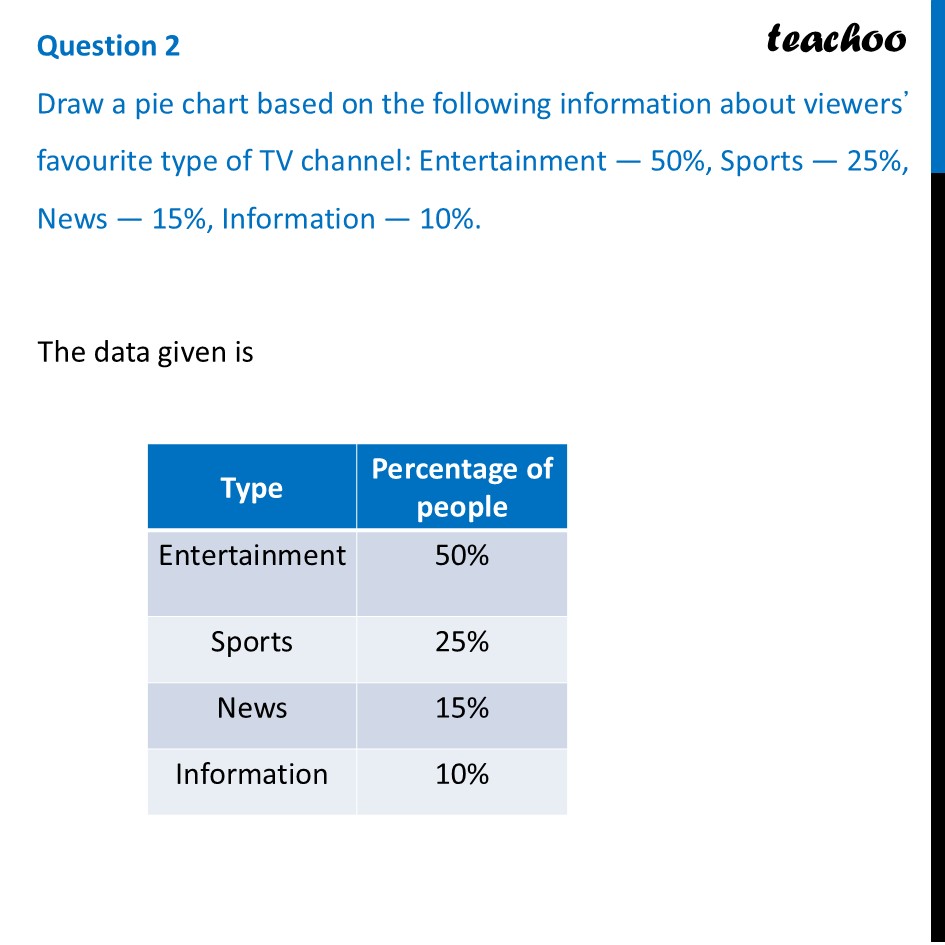
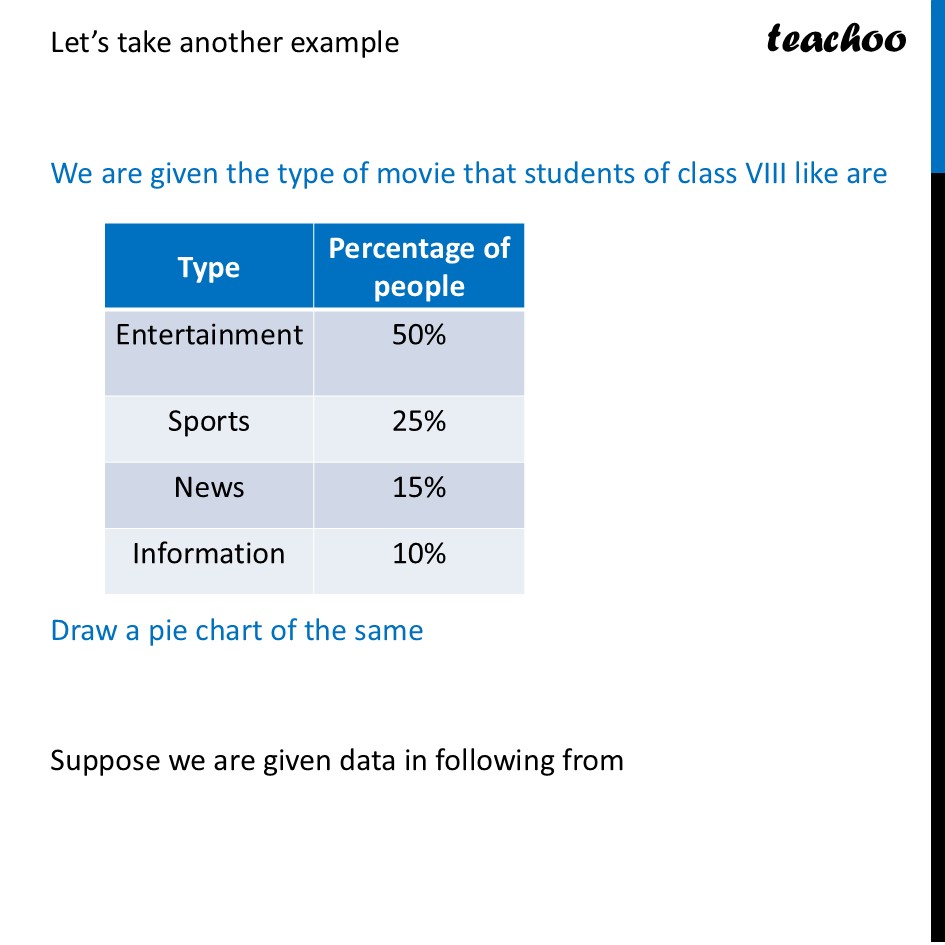
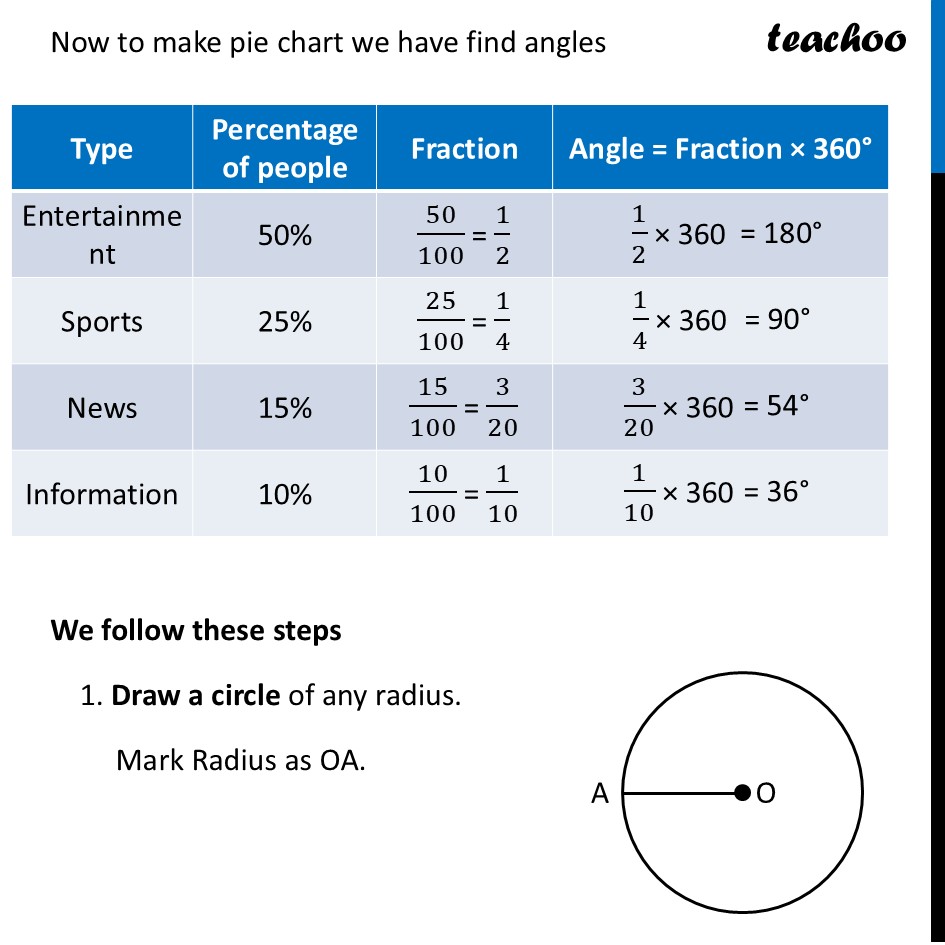
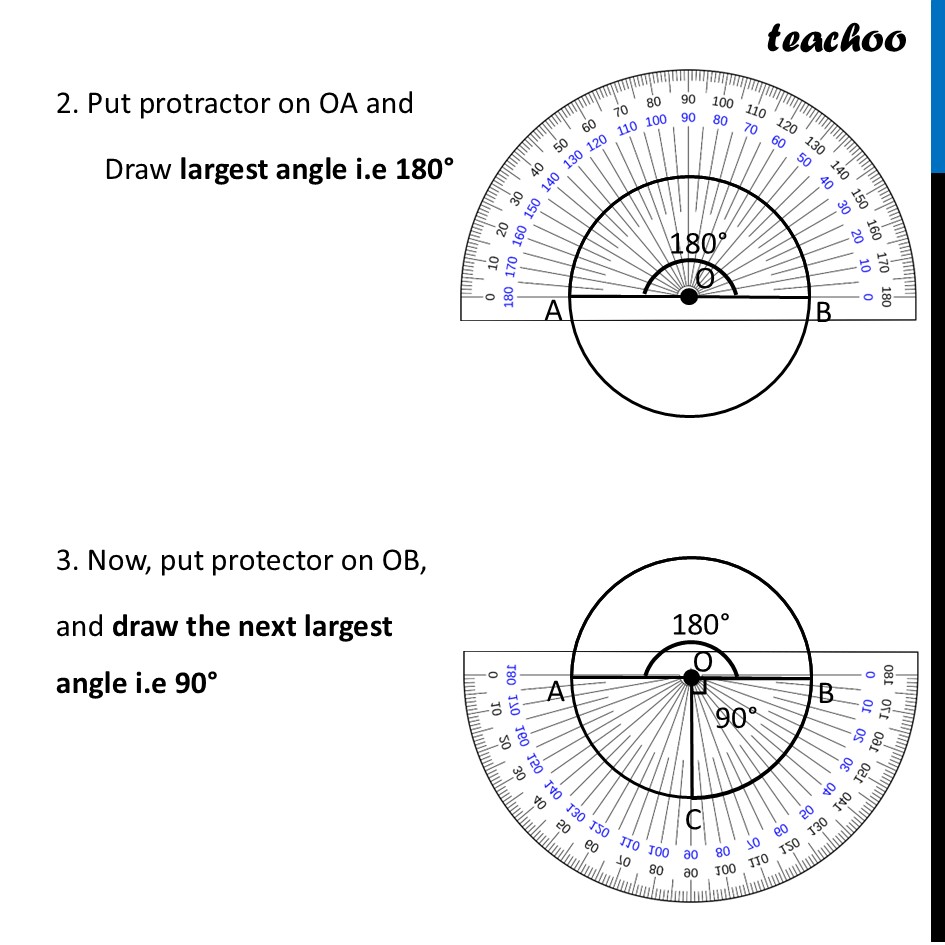
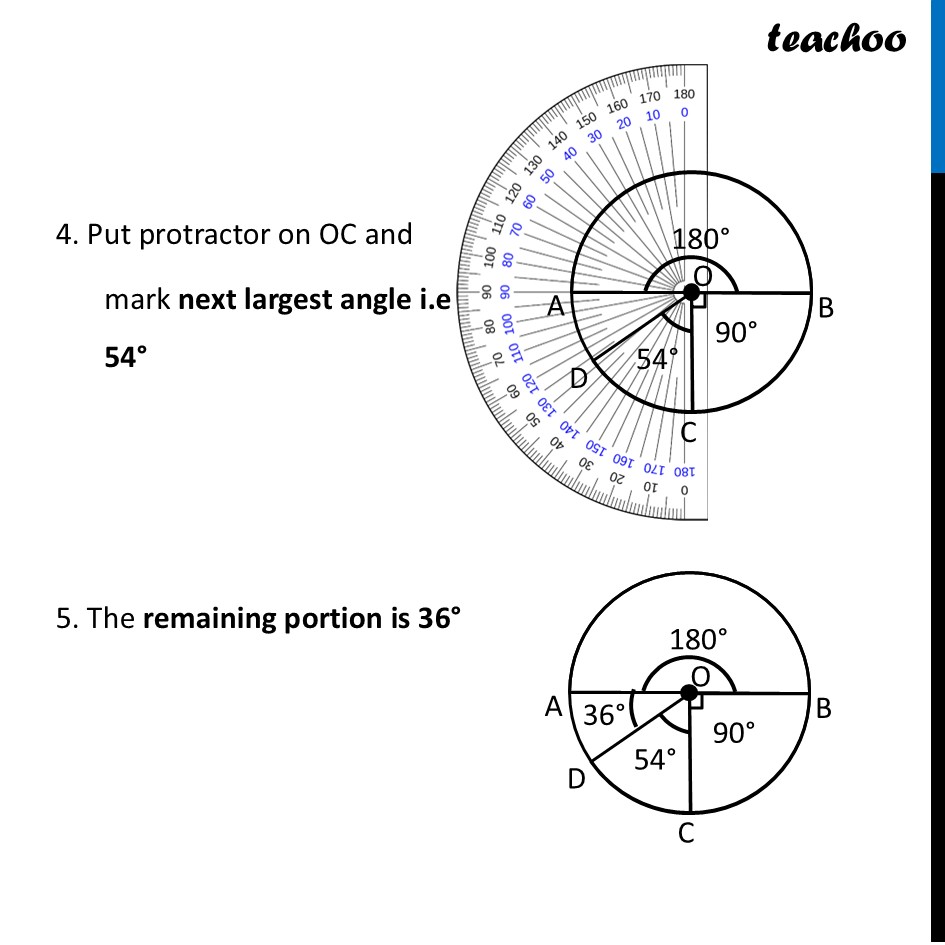
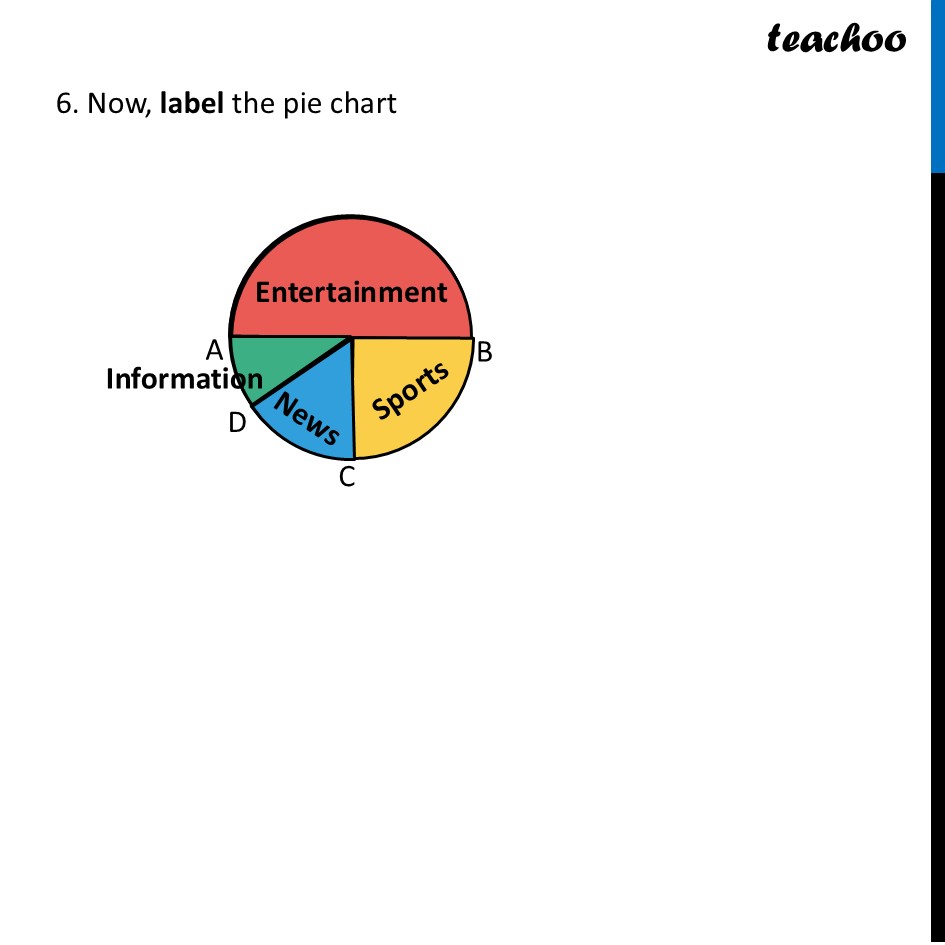
Question 2 Draw a pie chart based on the following information about viewers᾿ favourite type of TV channel: Entertainment — 50%, Sports — 25%, News — 15%, Information — 10%.The data given is Let’s take another example We are given the type of movie that students of class VIII like are Draw a pie chart of the same Suppose we are given data in following from Now to make pie chart we have find angles We follow these steps 1. Draw a circle of any radius. Mark Radius as OA. 2. Put protractor on OA and Draw largest angle i.e 180° 3. Now, put protector on OB, and draw the next largest angle i.e 90° 4. Put protractor on OC and mark next largest angle i.e 54° 5. The remaining portion is 36° 6. Now, label the pie chart

CA Maninder Singh's photo - Co-founder, Teachoo

Made by

CA Maninder Singh

CA Maninder Singh is a Chartered Accountant for the past 16 years. He also provides Accounts Tax GST Training in Delhi, Kerala and online.