Pie Chart - Explanation with Examples [Class 8 Ganita Prakash II] - Pie Chart

part 2 - Pie Chart - Pie Chart - Chapter 3 Class 8 - Proportional Reasoning-2 (Ganita Prakash II) - Class 8 (Ganita Prakash - 1, 2 & Old NCERT)

Remove Ads Take short quiz All Quiz and Worksheets

Transcript

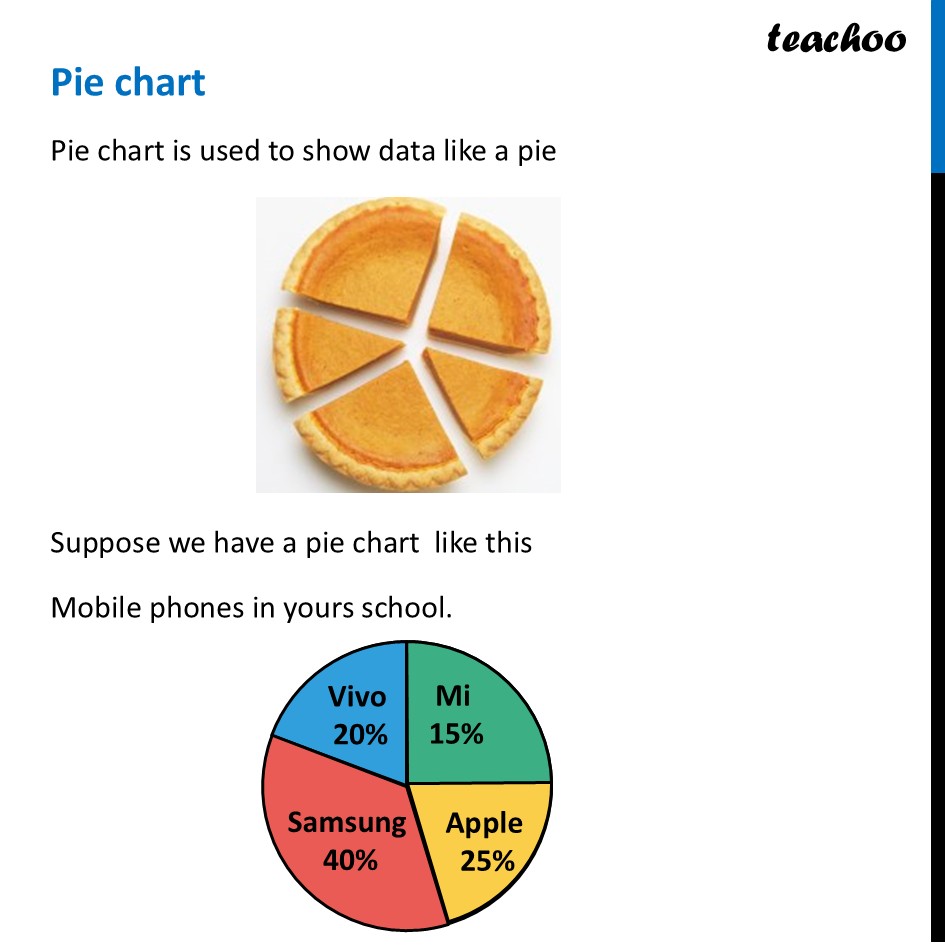
Pie chartPie chart is used to show data like a pie Suppose we have a pie chart like this Mobile phones in yours school. Suppose total mobile phones are 1000 How many phones are of Apple? Number of Apple phones = 25% × 1000 = 25/100 × 1000 = 25 × 10 = 250 So, there are 250 phones of Apple But, how to draw a pie chart?

CA Maninder Singh's photo - Co-founder, Teachoo

Made by

CA Maninder Singh

CA Maninder Singh is a Chartered Accountant with 16+ years of practical experience and 20+ years of teaching experience. At Teachoo, he simplifies Accounts, Tax and GST with step-by-step examples so students can apply concepts confidently in exams and real life.

For an uninterrupted learning experience, students can use Teachoo Black to remove ads and focus better.