

Figure it out - Page 62
Last updated at February 24, 2026 by Teachoo
Transcript
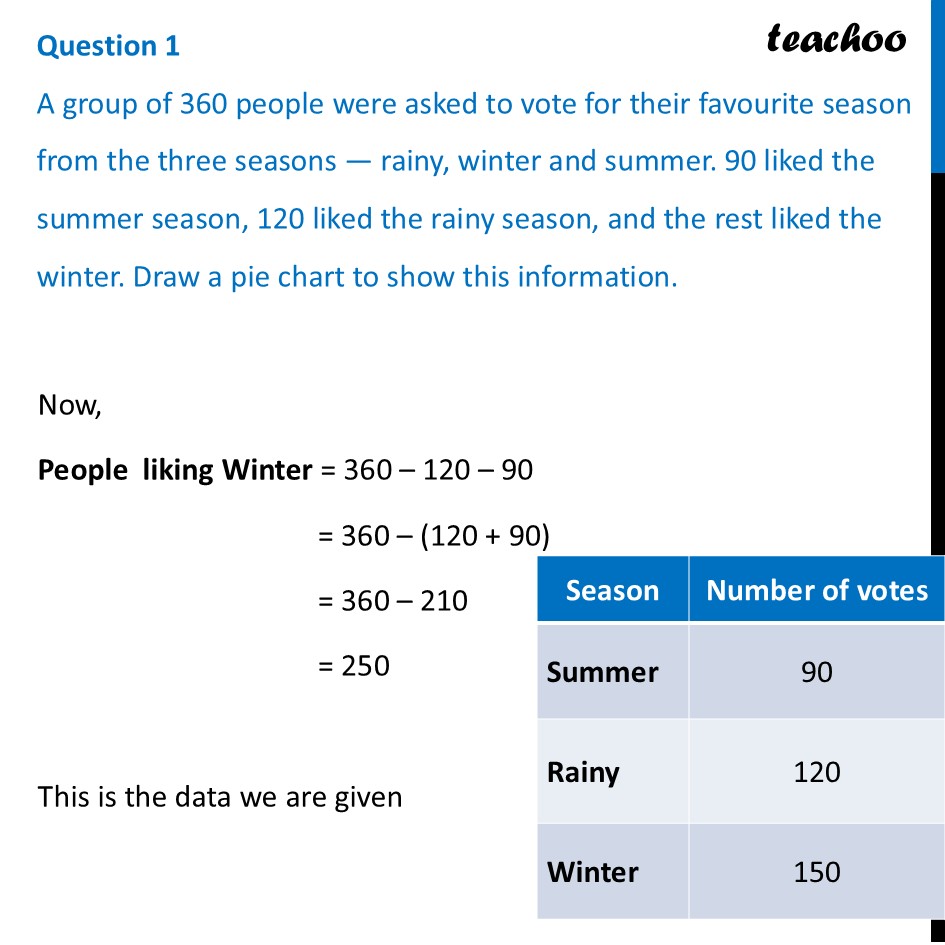
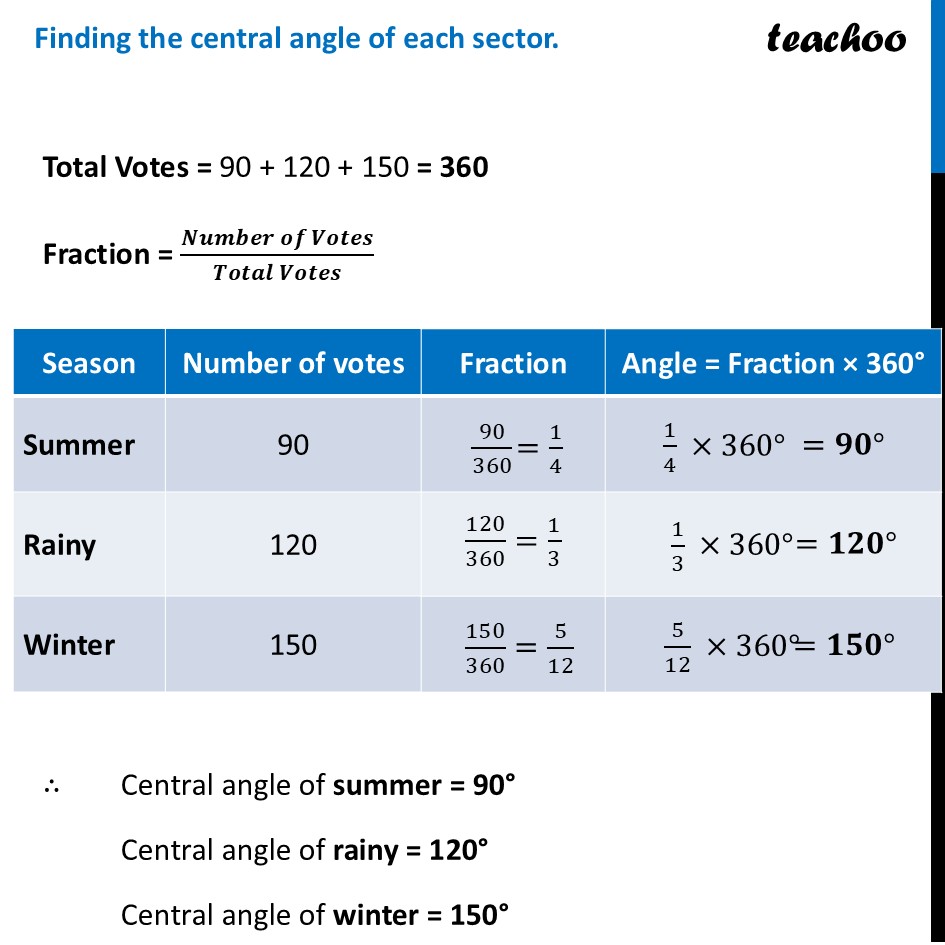
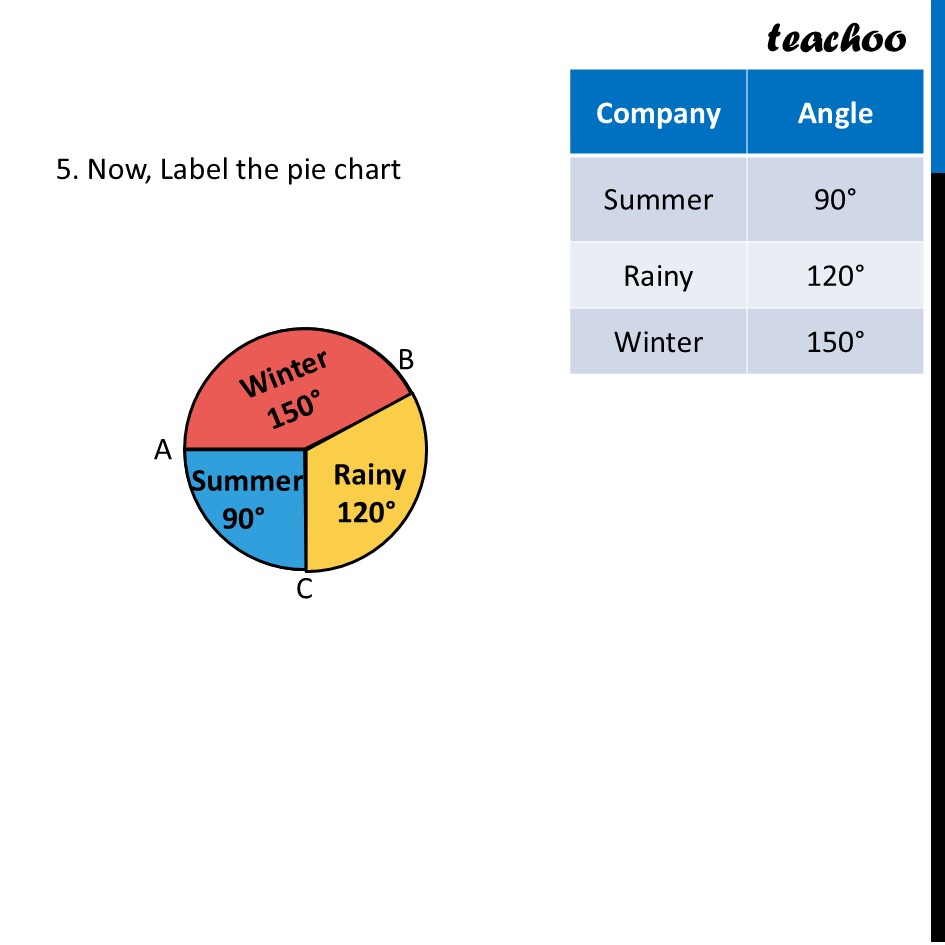
Question 1 A group of 360 people were asked to vote for their favourite season from the three seasons — rainy, winter and summer. 90 liked the summer season, 120 liked the rainy season, and the rest liked the winter. Draw a pie chart to show this information.Now, People liking Winter = 360 – 120 – 90 = 360 – (120 + 90) = 360 – 210 = 250 This is the data we are given Finding the central angle of each sector.Total Votes = 90 + 120 + 150 = 360 Fraction = (𝑵𝒖𝒎𝒃𝒆𝒓 𝒐𝒇 𝑽𝒐𝒕𝒆𝒔)/(𝑻𝒐𝒕𝒂𝒍 𝑽𝒐𝒕𝒆𝒔) ∴ Central angle of summer = 90° Central angle of rainy = 120° Central angle of winter = 150° Drawing a pie chart Steps of Construction 1. Draw a circle of any radius. Mark Radius as OA. 2. Put protractor on AO and Draw largest angle 150° 3. Now, put protractor on AO and Mark angle 90° 4. The remaining portion is 120° 5. Now, Label the pie chart
