Last updated at February 2, 2026 by Teachoo
Transcript
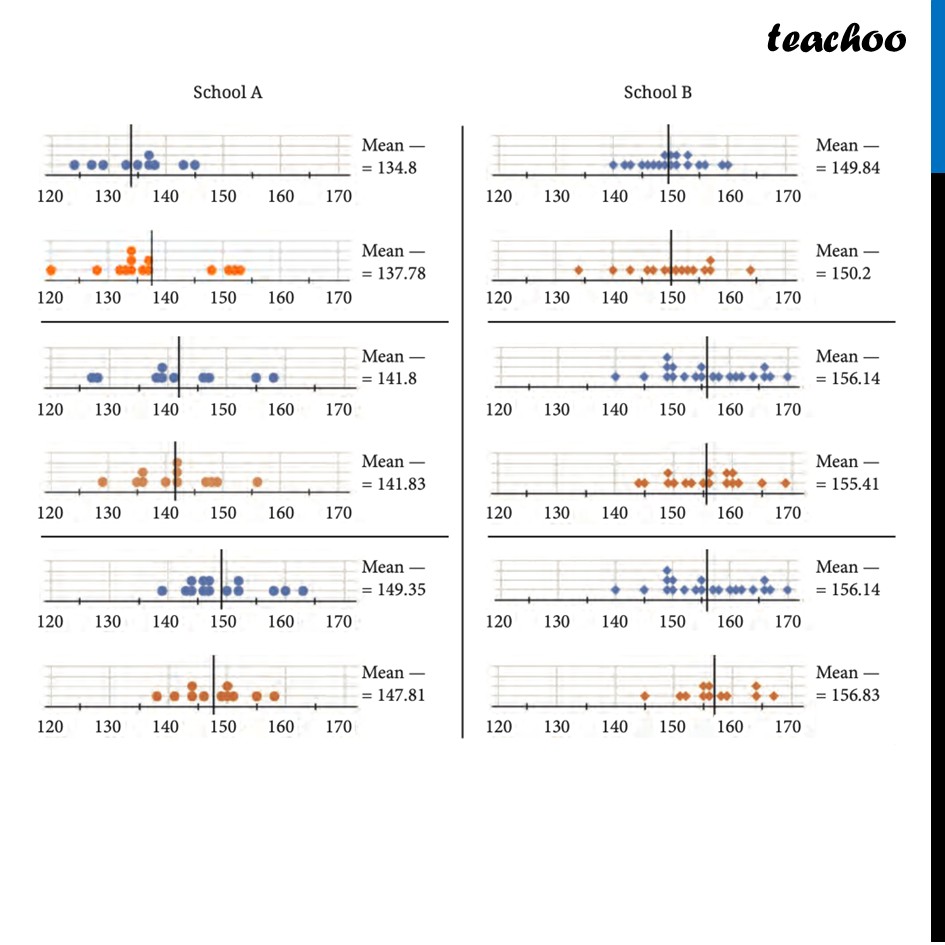
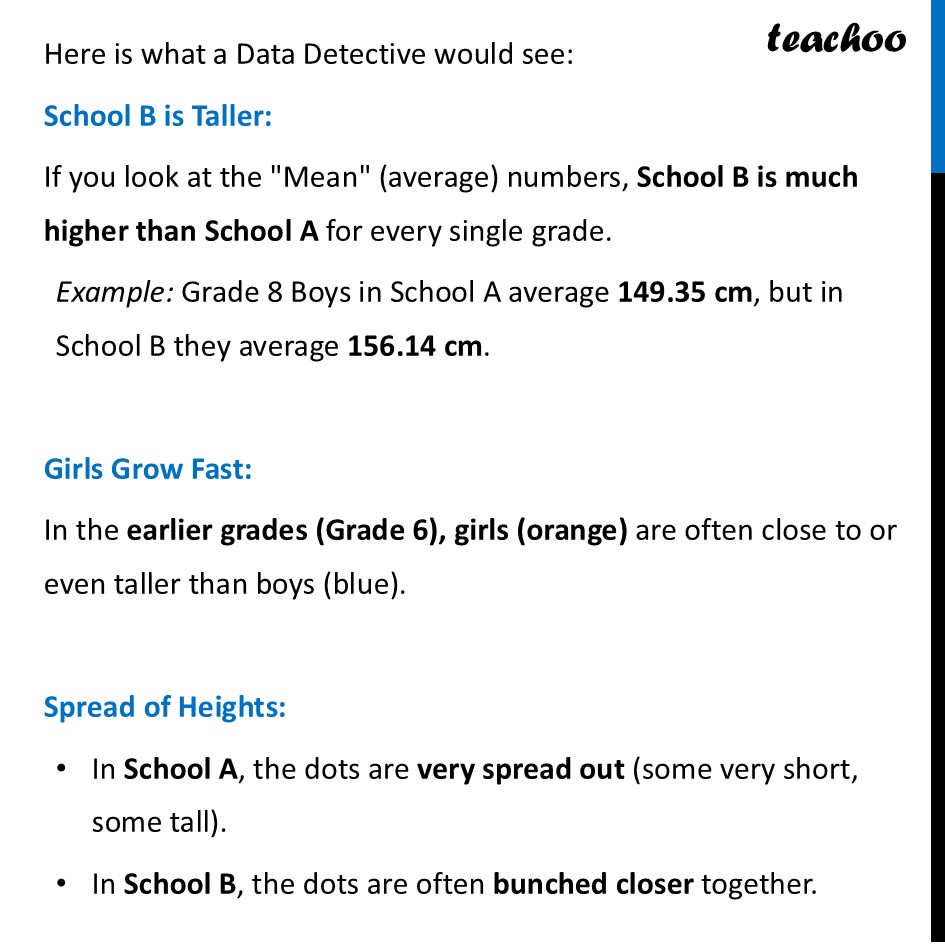
Part 1: The Dot Plots (School A vs. School B)Welcome to the world of being a Data Detective. 🕵️♂️🔍 Think of data as clues. Just like detective pieces together clues to solve a mystery, we use data (numbers, measurements, and graphs) to tell a story about the real world. We are given this data Following are the dot plots of heights of boys (in blue) and girls (in orange) of Grades 6, 7 and 8 (in that order) of two different schools. Talk What do you notice? Share your observations. Here is what a Data Detective would see: School B is Taller: If you look at the "Mean" (average) numbers, School B is much higher than School A for every single grade. Example: Grade 8 Boys in School A average 149.35 cm, but in School B they average 156.14 cm. Girls Grow Fast: In the earlier grades (Grade 6), girls (orange) are often close to or even taller than boys (blue). Spread of Heights: In School A, the dots are very spread out (some very short, some tall). In School B, the dots are often bunched closer together.
