![Cricket Match Graph - with Questions [Class 7 Part 2 Ganita Prakash] - Data Visualisation](https://cdn.teachoo.com/9c6328a6-db46-4216-a789-cfe967c53579/slide34.jpg)
Last updated at February 2, 2026 by Teachoo
Transcript
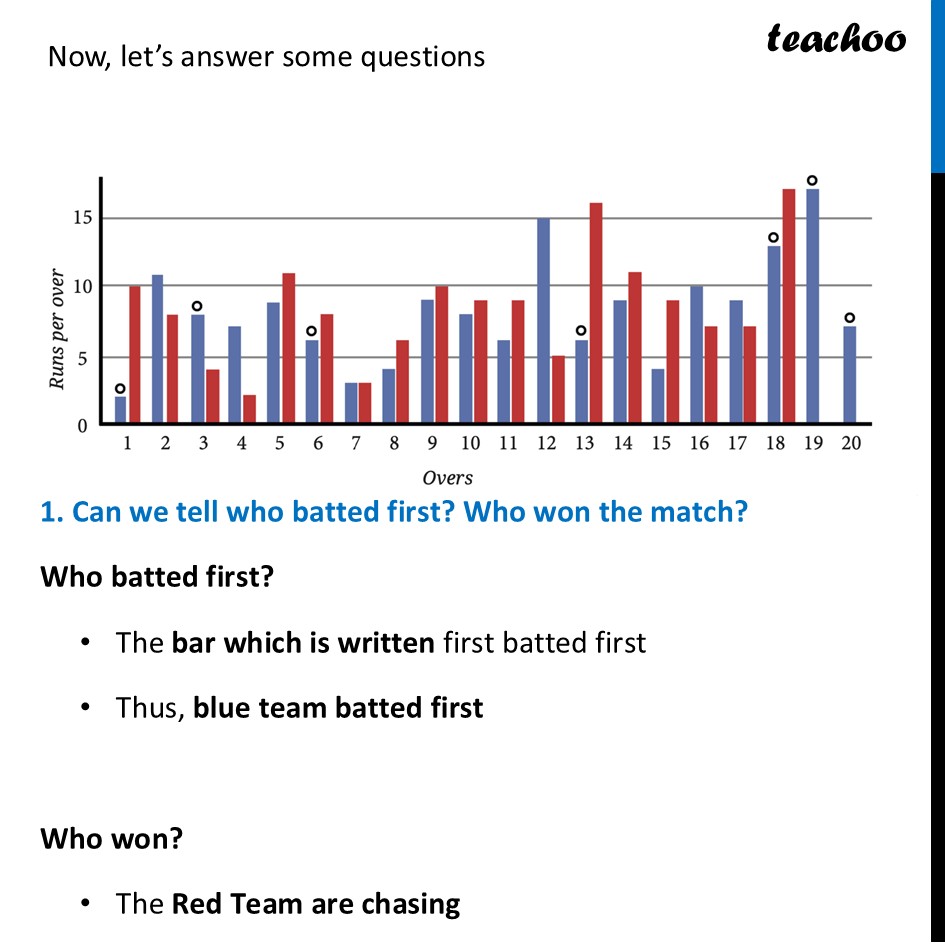
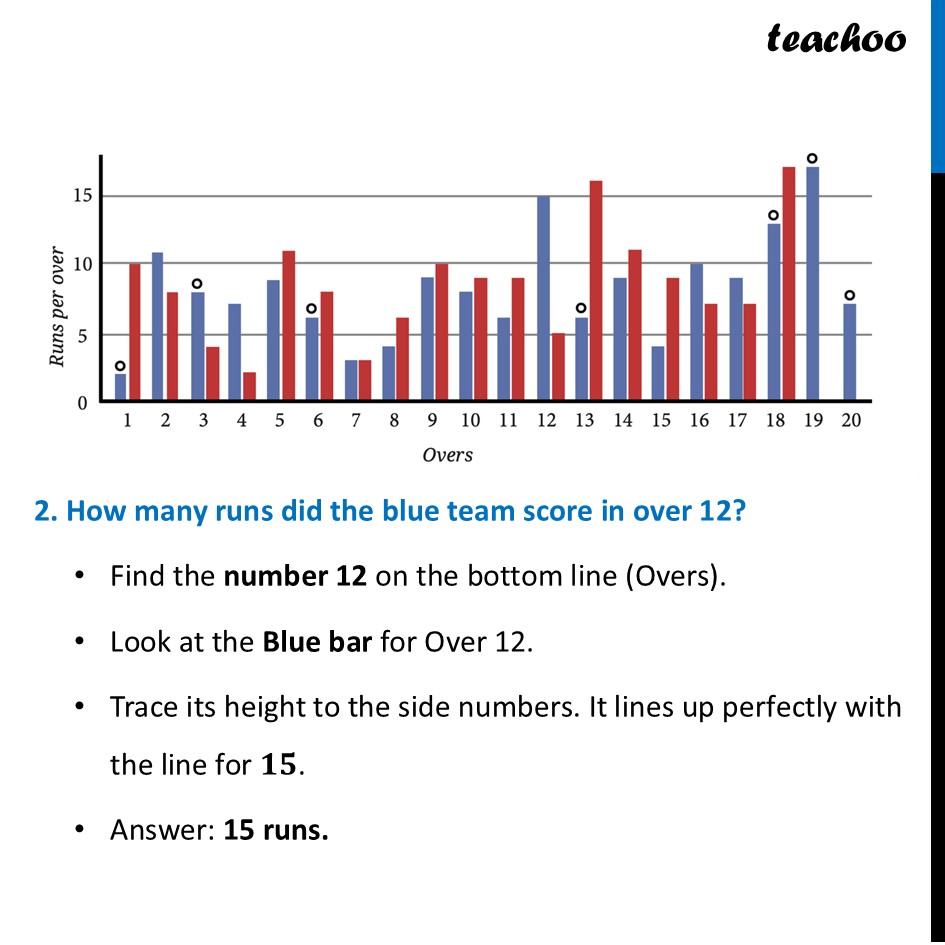
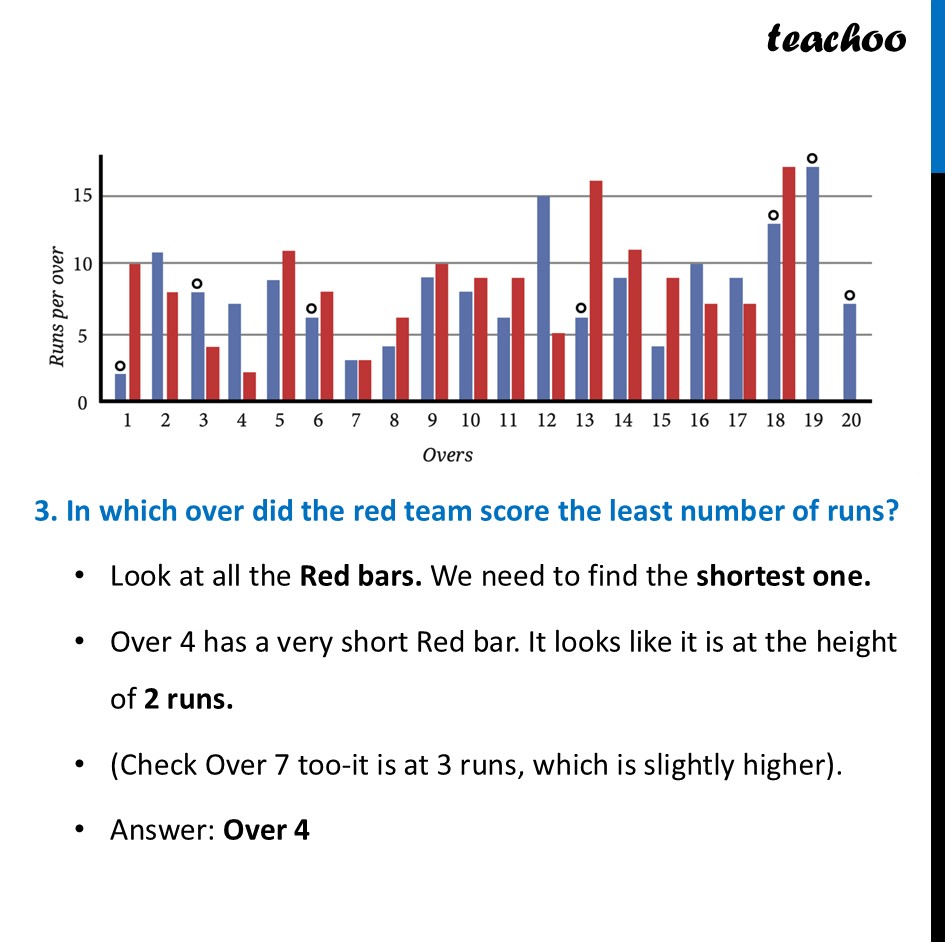
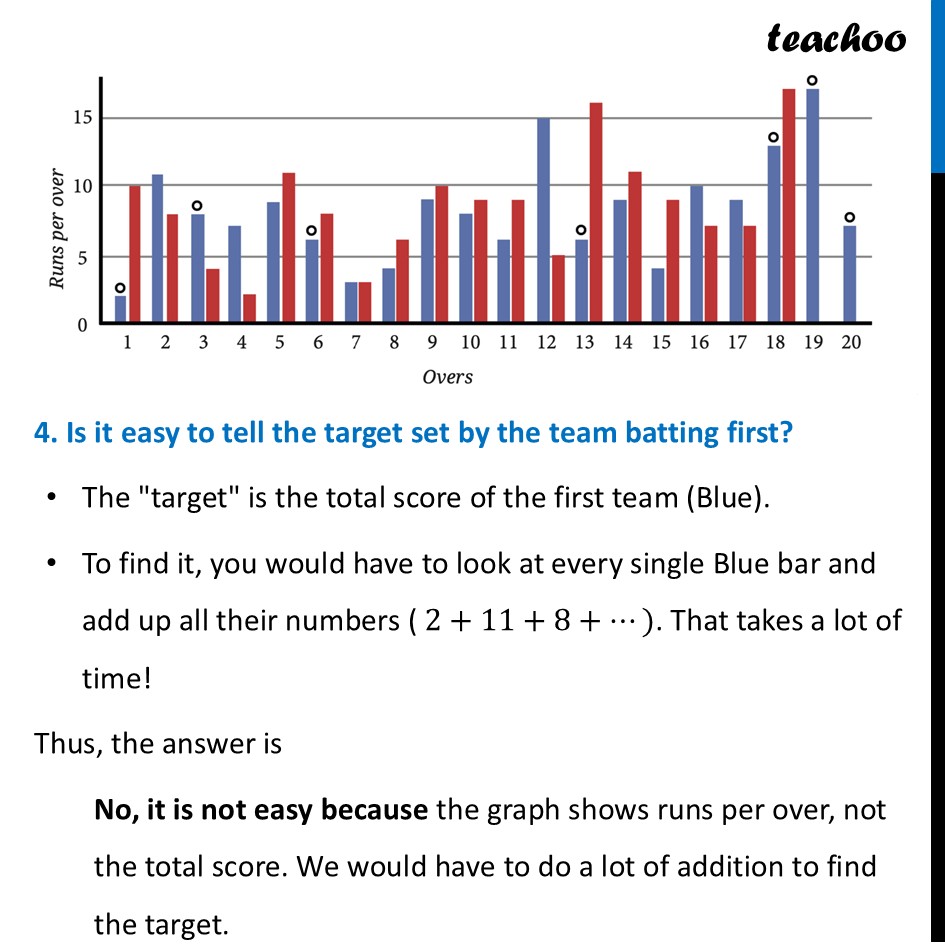
Cricket Match GraphIn a Cricket Match, they share a graph like this We can find out what happened in the whole match just by looking at the graph. This is a Double Bar Graph. The Blue bars are for one team, and the Red bars are for the other team. The ”white dots" on top of a bar mean a wicket fell in that over Now, let’s answer some questions 1. Can we tell who batted first? Who won the match? Who batted first? The bar which is written first batted first Thus, blue team batted first Who won? The Red Team are chasing They did not lose a wicket And, the Red team stopped in Over 18 (they didn't need to play the last two overs), it means they reached the target score. Thus, Red team won! 2. How many runs did the blue team score in over 12? Find the number 12 on the bottom line (Overs). Look at the Blue bar for Over 12. Trace its height to the side numbers. It lines up perfectly with the line for 𝟏𝟓. Answer: 15 runs. 3. In which over did the red team score the least number of runs? Look at all the Red bars. We need to find the shortest one. Over 4 has a very short Red bar. It looks like it is at the height of 2 runs. (Check Over 7 too-it is at 3 runs, which is slightly higher). Answer: Over 4 4. Is it easy to tell the target set by the team batting first? The "target" is the total score of the first team (Blue). To find it, you would have to look at every single Blue bar and add up all their numbers ( 2+11+8+…). That takes a lot of time! Thus, the answer is No, it is not easy because the graph shows runs per over, not the total score. We would have to do a lot of addition to find the target.
