![Summer and Winter at the Same Time - [Ganita Prakash Class 7 Part 2] - Data Visualisation](https://cdn.teachoo.com/999c5d9a-aeec-4cb8-ae2a-89d4d26f6d65/slide27.jpg)
Last updated at February 2, 2026 by Teachoo
Transcript
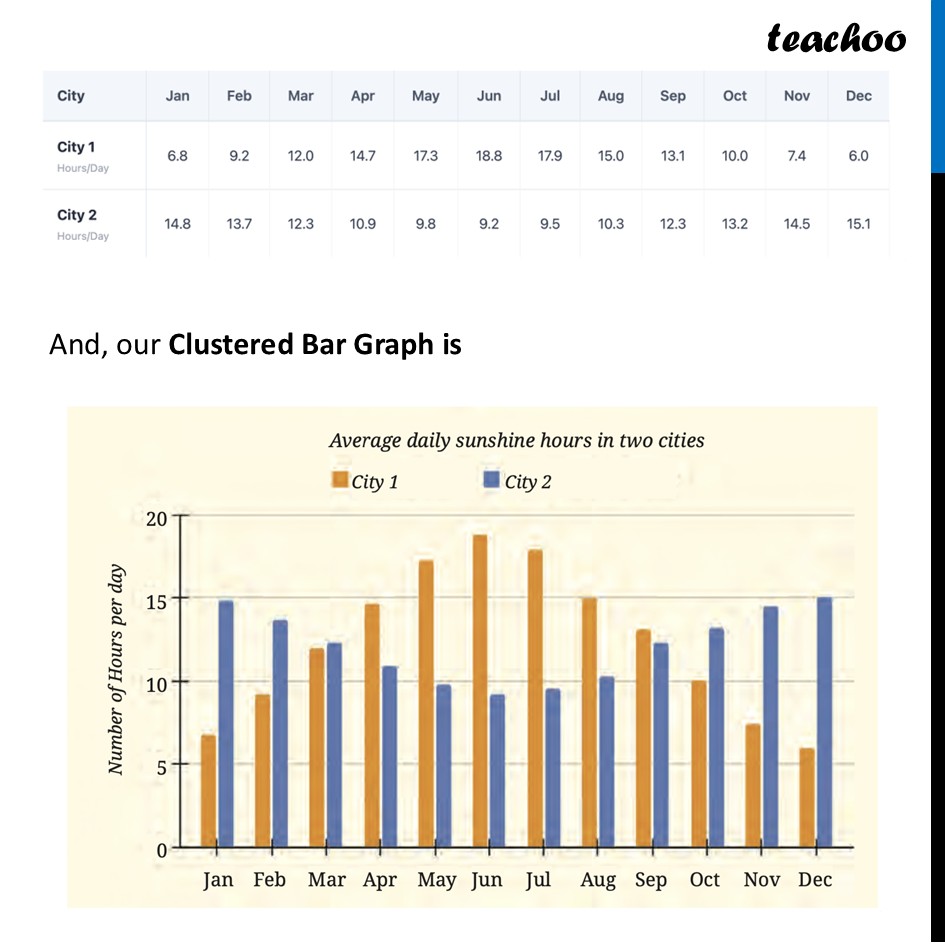
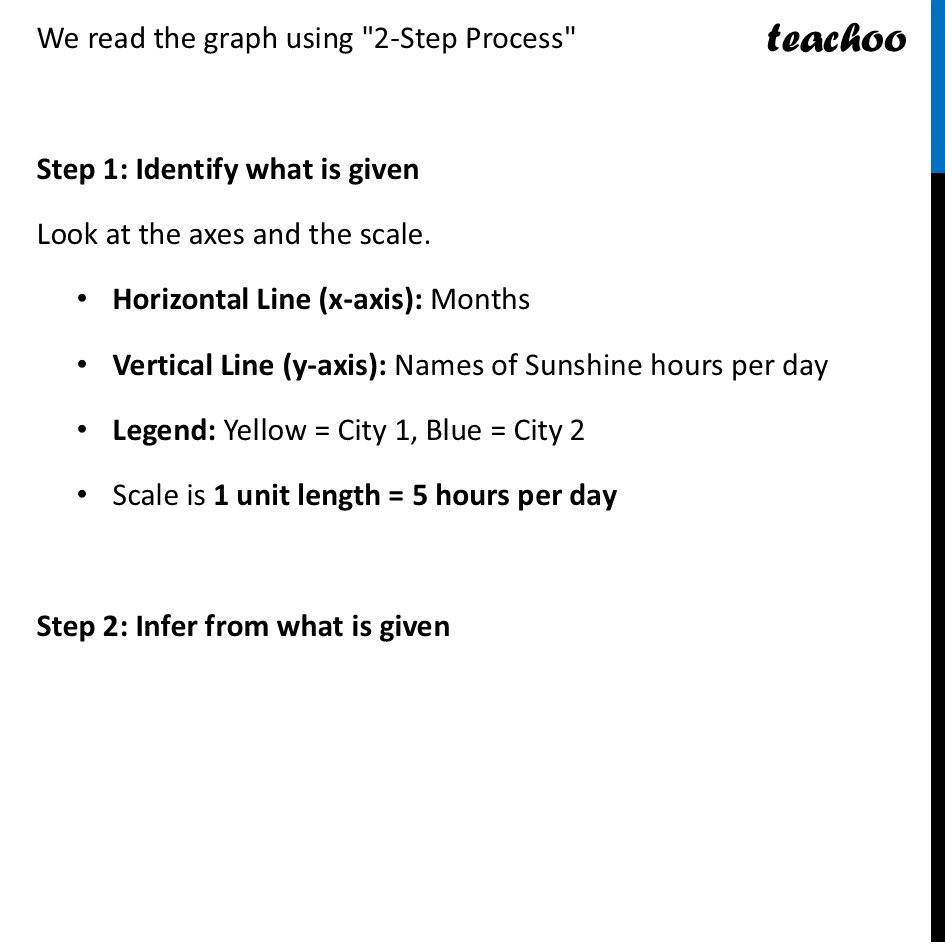
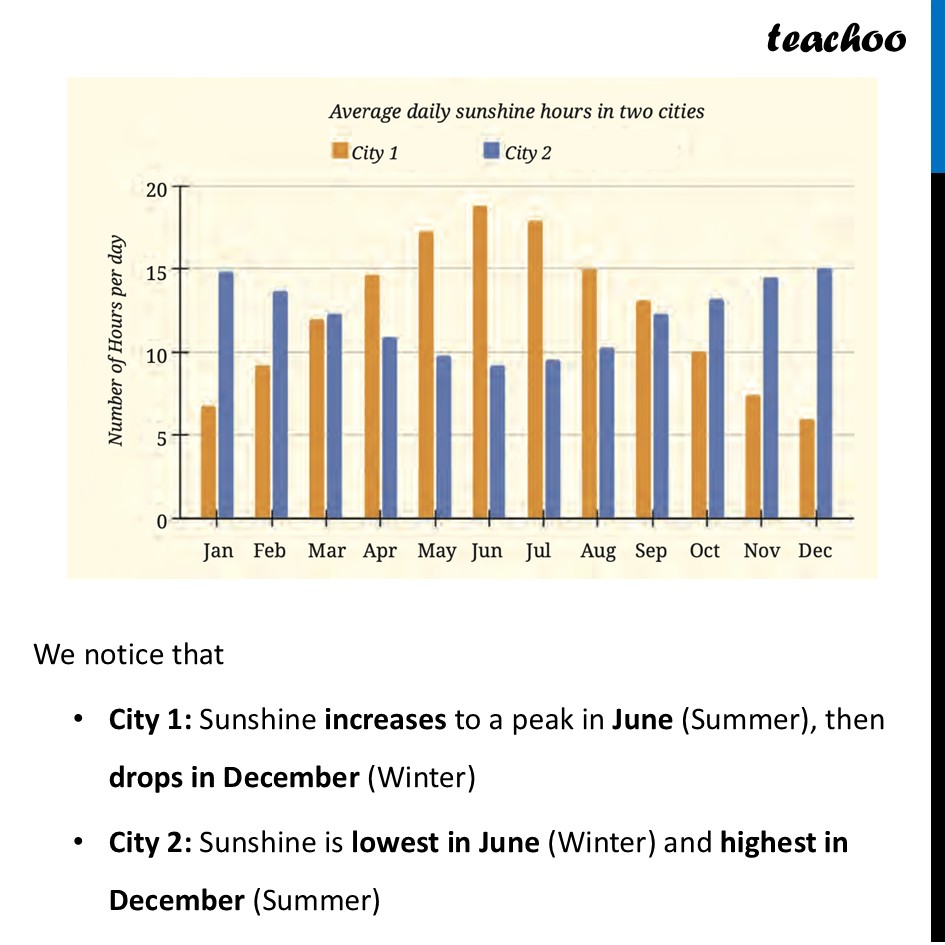
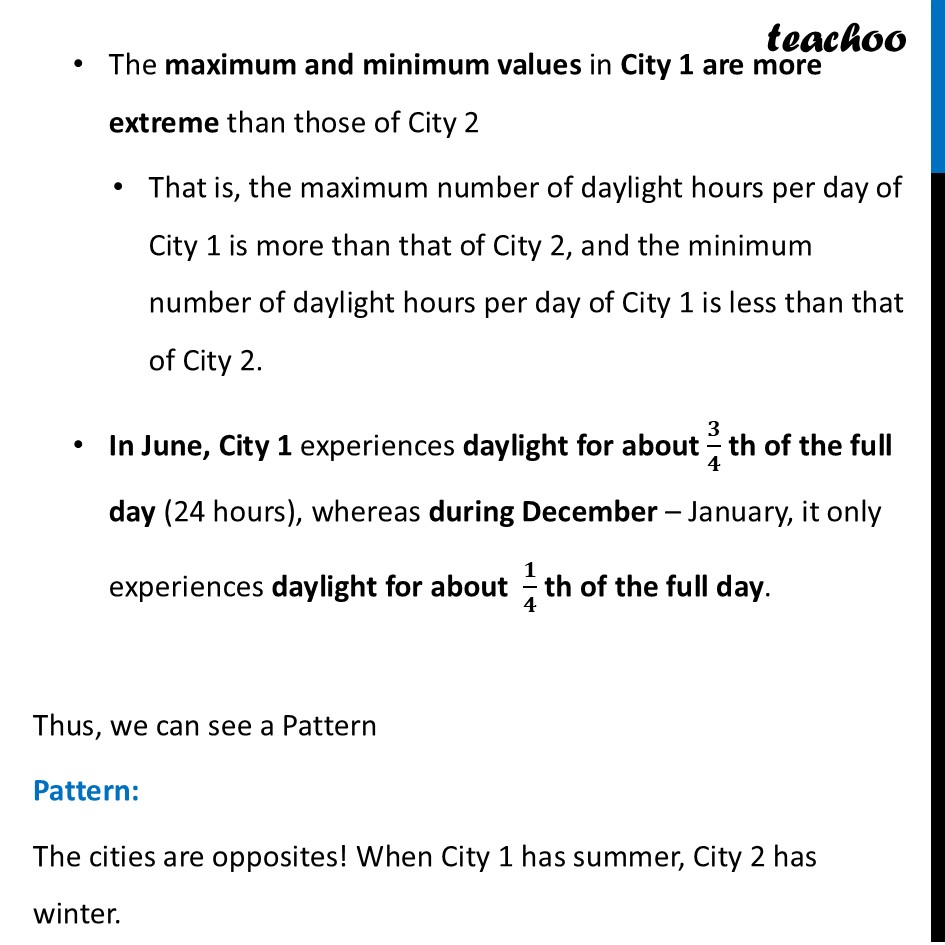
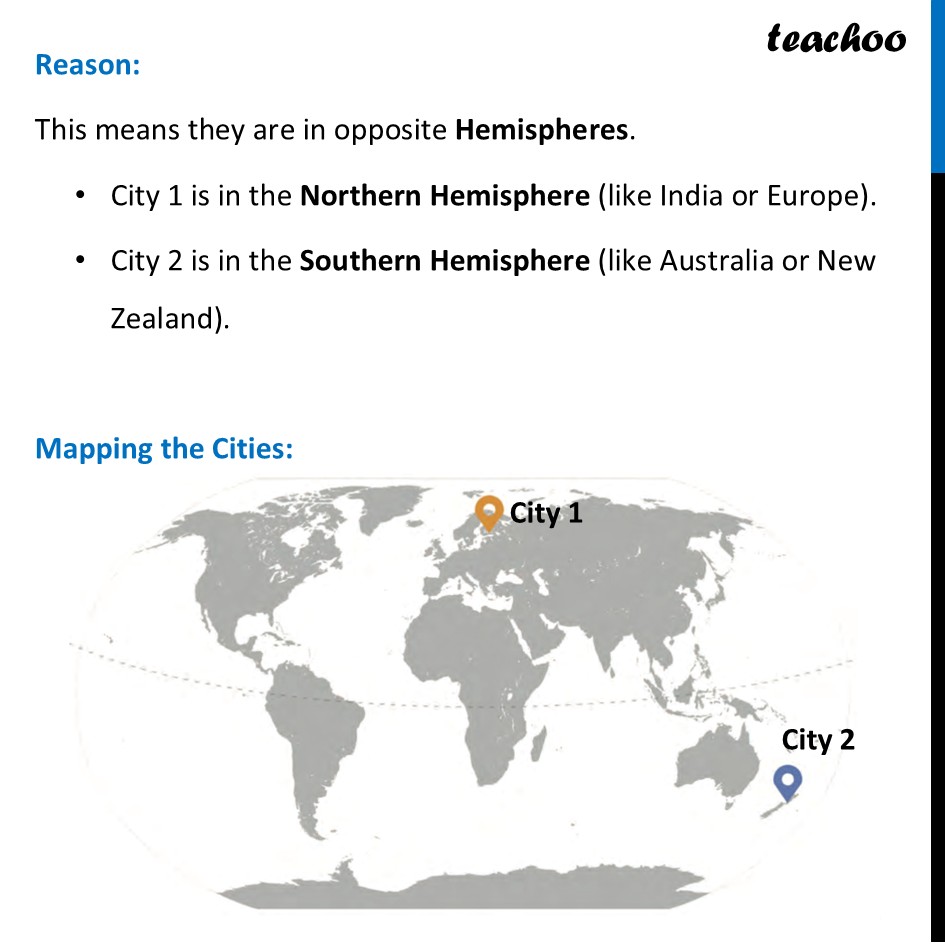
Summer and Winter at the Same TimeWe are given data for "City 1" and "City 2" regarding sunshine hours It will be easier for us to compare both cities if we use Number of hours of sunshine per day So, our table changes. We divide the number with the number of days in the month. It becomes And, our Clustered Bar Graph is We read the graph using "2-Step Process" Step 1: Identify what is given Look at the axes and the scale. Horizontal Line (x-axis): Months Vertical Line (y-axis): Names of Sunshine hours per day Legend: Yellow = City 1, Blue = City 2 Scale is 1 unit length = 5 hours per day Step 2: Infer from what is given We notice that City 1: Sunshine increases to a peak in June (Summer), then drops in December (Winter) City 2: Sunshine is lowest in June (Winter) and highest in December (Summer) The maximum and minimum values in City 1 are more extreme than those of City 2 That is, the maximum number of daylight hours per day of City 1 is more than that of City 2, and the minimum number of daylight hours per day of City 1 is less than that of City 2. In June, City 1 experiences daylight for about 𝟑/𝟒 th of the full day (24 hours), whereas during December – January, it only experiences daylight for about 𝟏/𝟒 th of the full day. Thus, we can see a Pattern Pattern: The cities are opposites! When City 1 has summer, City 2 has winter. Reason: This means they are in opposite Hemispheres. City 1 is in the Northern Hemisphere (like India or Europe). City 2 is in the Southern Hemisphere (like Australia or New Zealand). Mapping the Cities: City 1 is Helsinki, Finland. It is very far North. That is why the difference is so extreme (18 hours of sun in June, but only 6 hours in Dec). City 2 is Wellington, New Zealand. It is far South.
