![Rocket Launches (Horizontal Graphs & Analysis) - [Class 7 Maths] - Data Visualisation](https://cdn.teachoo.com/d24fae96-e427-4100-b094-9ac0c747816b/slide12.jpg)

Last updated at February 2, 2026 by Teachoo
Transcript
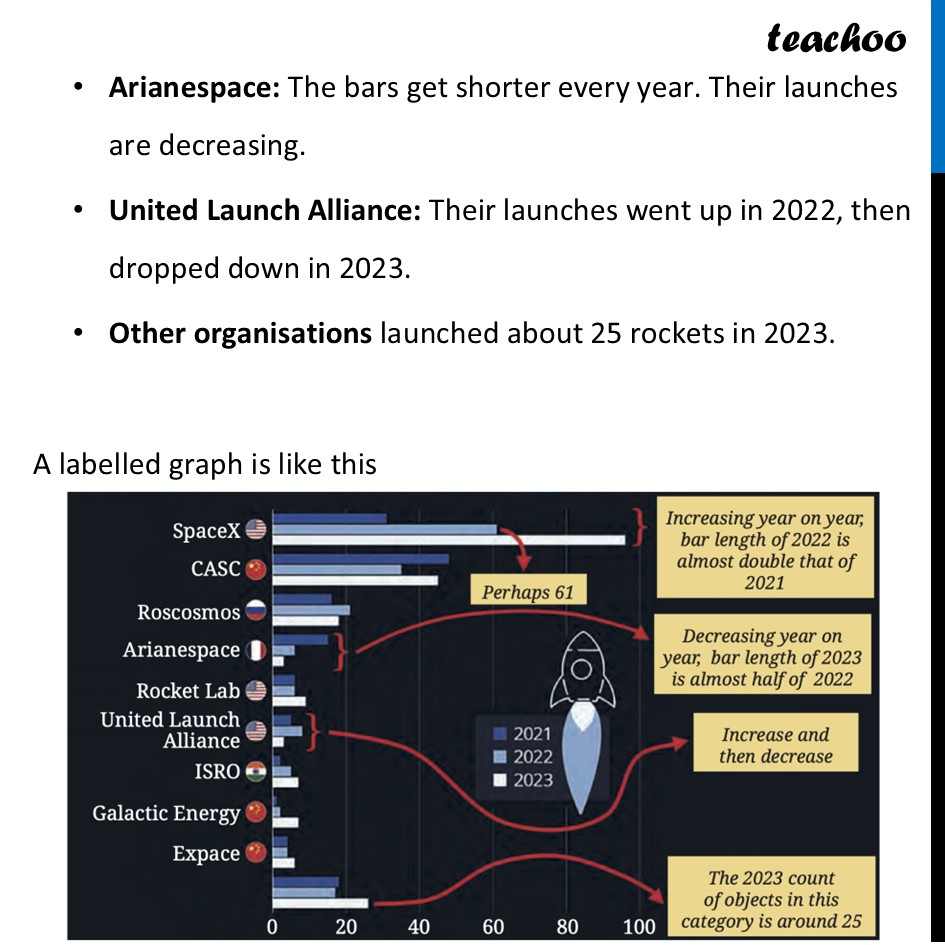
Rocket Launches (Horizontal Graphs & Analysis)Given is a bar graph for Rocket launches by different organizations (SpaceX, ISRO, etc.) for 2021, 2022, and 2023. Given a Horizontal Bar Graph. Instead of standing up, the bars lay sideways This graph has a lot of information given, so to read it we follow the "2-Step Process" The "2-Step Process" to Understanding Graphs Step 1: Identify what is given Look at the axes and the scale. Horizontal Line (x-axis): Number of launches. Vertical Line (y-axis): Names of organizations. Legend: Dark blue = 2021, Medium blue = 2022, Light blue = 2023. Scale is 1 unit length = 20 rockets. Step 2: Infer from what is given "Infer" means to act like a detective and find the story behind the numbers. SpaceX: The bars get much longer every year. They almost doubled from 2021 to 2022! Arianespace: The bars get shorter every year. Their launches are decreasing. United Launch Alliance: Their launches went up in 2022, then dropped down in 2023. Other organisations launched about 25 rockets in 2023. A labelled graph is like this
