
Coefficient of Variation
Last updated at Dec. 16, 2024 by Teachoo
Transcript
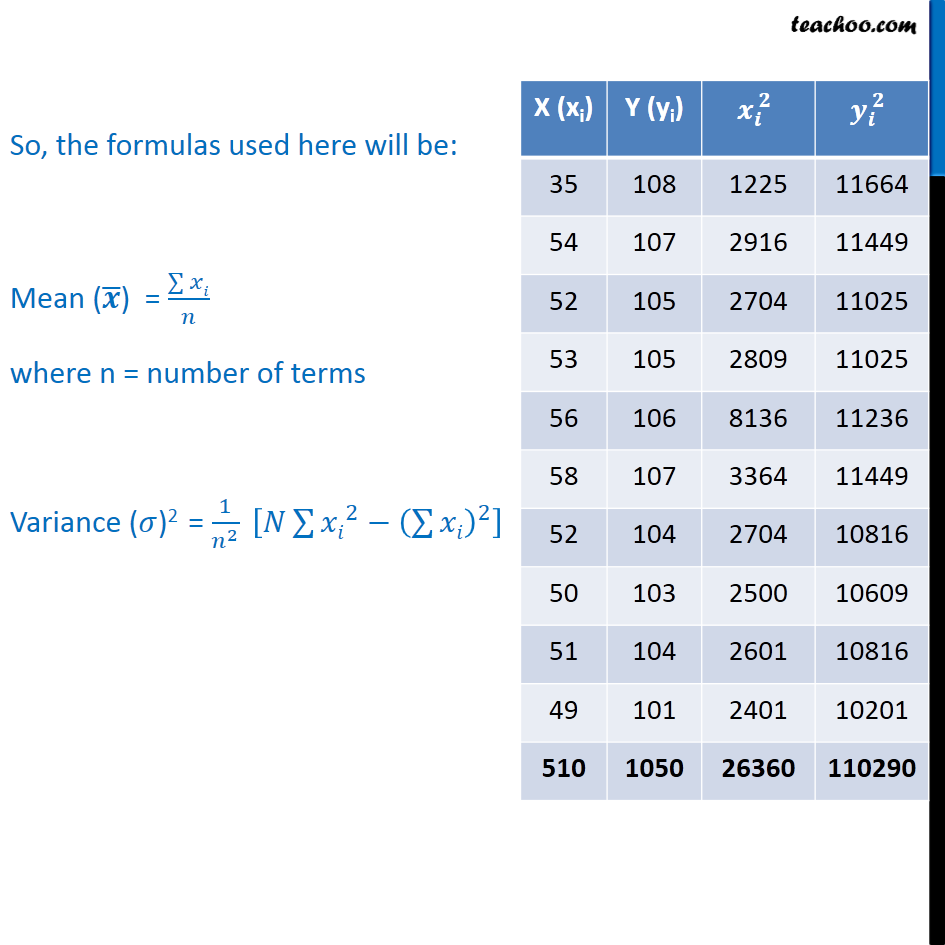
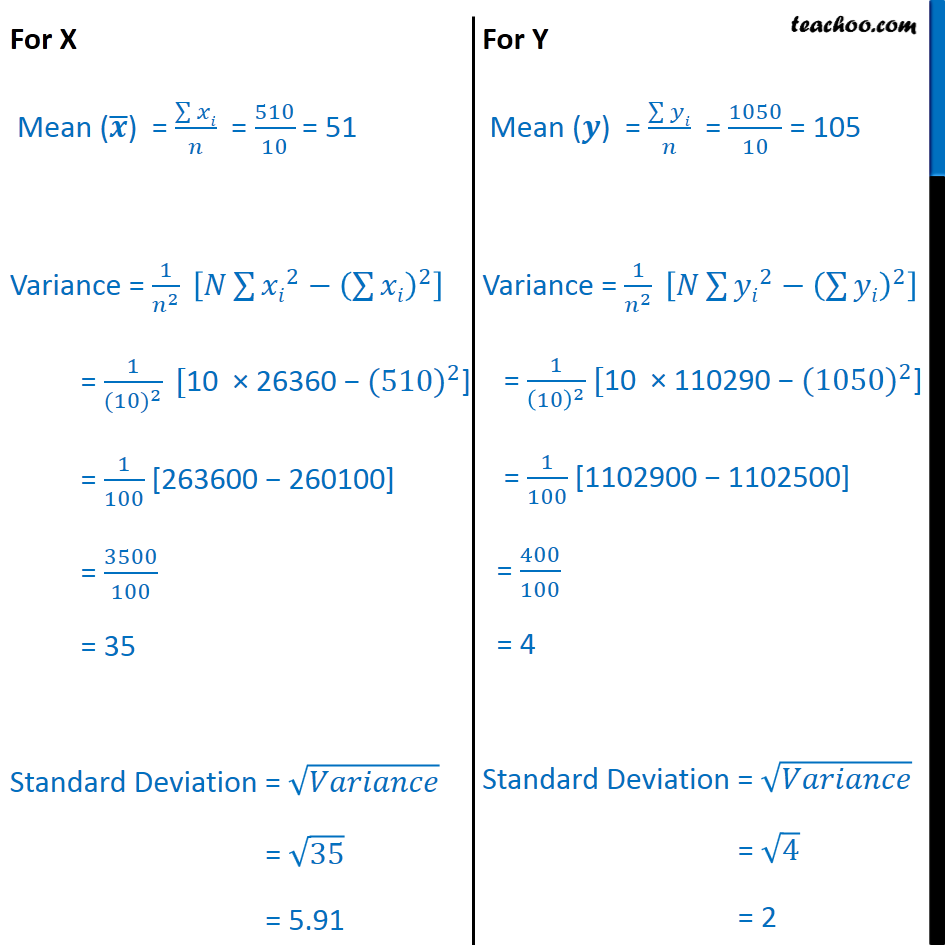
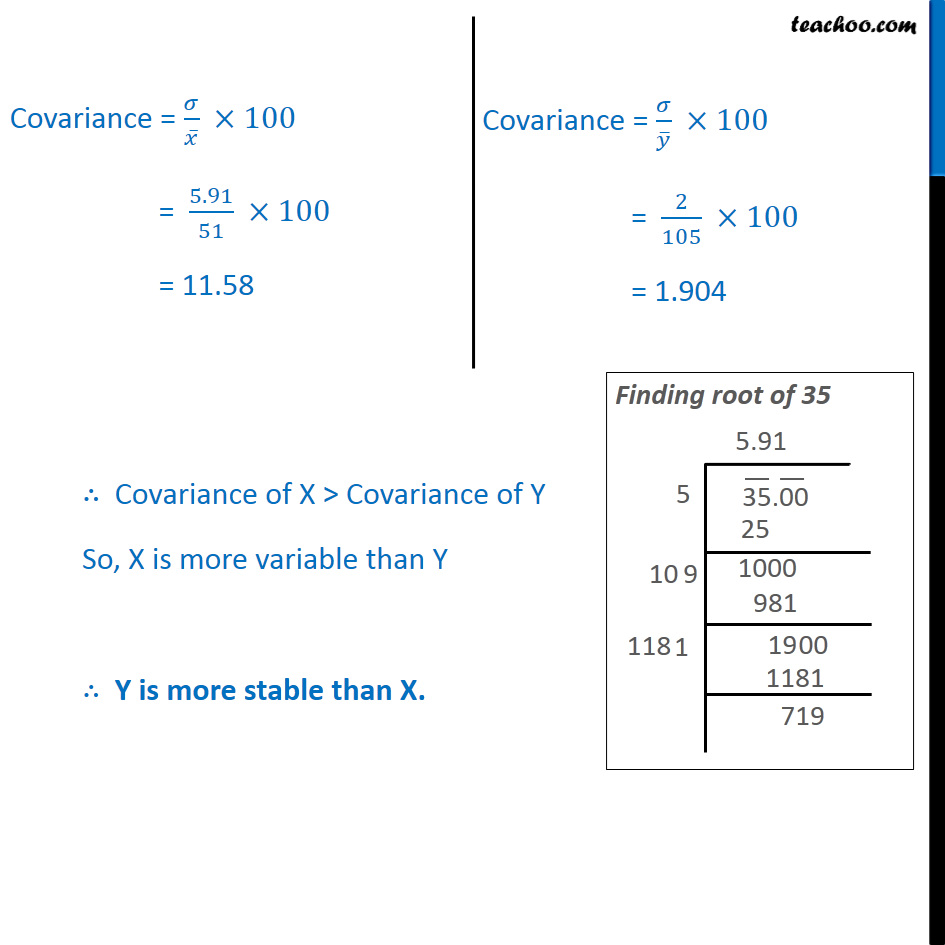
Ex15.3, 2 From the prices of shares X and Y below, find out which is more stable in value: The group having more Coefficient of Variation will be more variable. Coefficient of Variation (C.V.) = 𝜎/𝒙 ̅ × 100 where 𝜎 = Standard Deviation 𝒙 ̅ = Mean Finding standard deviation & mean of both Group A and Group B. But as the data given is raw data, Hence, there is no values for frequency (𝑓_𝑖) So, the formulas used here will be: Mean (𝒙 ̅) = (∑▒𝑥𝑖)/𝑛 where n = number of terms Variance (𝜎)2 = 1/𝑛^2 [𝑁∑▒〖𝑥𝑖〗^2 −(∑▒𝑥𝑖)^2 ] For X Mean (𝒙 ̅) = (∑▒𝑥𝑖)/𝑛 = 510/10 = 51 Variance = 1/𝑛^2 [𝑁∑▒〖𝑥𝑖〗^2 −(∑▒𝑥𝑖)^2 ] = 1/〖(10)〗^2 [10 × 26360 − 〖(510)〗^2] = 1/100 [263600 − 260100] = 3500/100 = 35 Standard Deviation = √𝑉𝑎𝑟𝑖𝑎𝑛𝑐𝑒 = √35 = 5.91 For Y Mean (𝒚) = (∑▒𝑦𝑖)/𝑛 = 1050/10 = 105 Variance = 1/𝑛^2 [𝑁∑▒〖𝑦𝑖〗^2 −(∑▒𝑦𝑖)^2 ] = 1/(10)^2 [10 × 110290 − 〖(1050)〗^2] = 1/100 [1102900 − 1102500] = 400/100 = 4 Standard Deviation = √𝑉𝑎𝑟𝑖𝑎𝑛𝑐𝑒 = √4 = 2 Covariance = 𝜎/𝑥 ̅ ×100 = 5.91/51 ×100 = 11.58 Covariance = 𝜎/𝑦 ̅ ×100 = 2/105 ×100 = 1.904 ∴ Covariance of X > Covariance of Y So, X is more variable than Y ∴ Y is more stable than X.
