You are here
Solution of Linear Equation in Two Variables
Solution of Linear Equation in Two Variables
Last updated at November 22, 2026 by Teachoo
Transcript
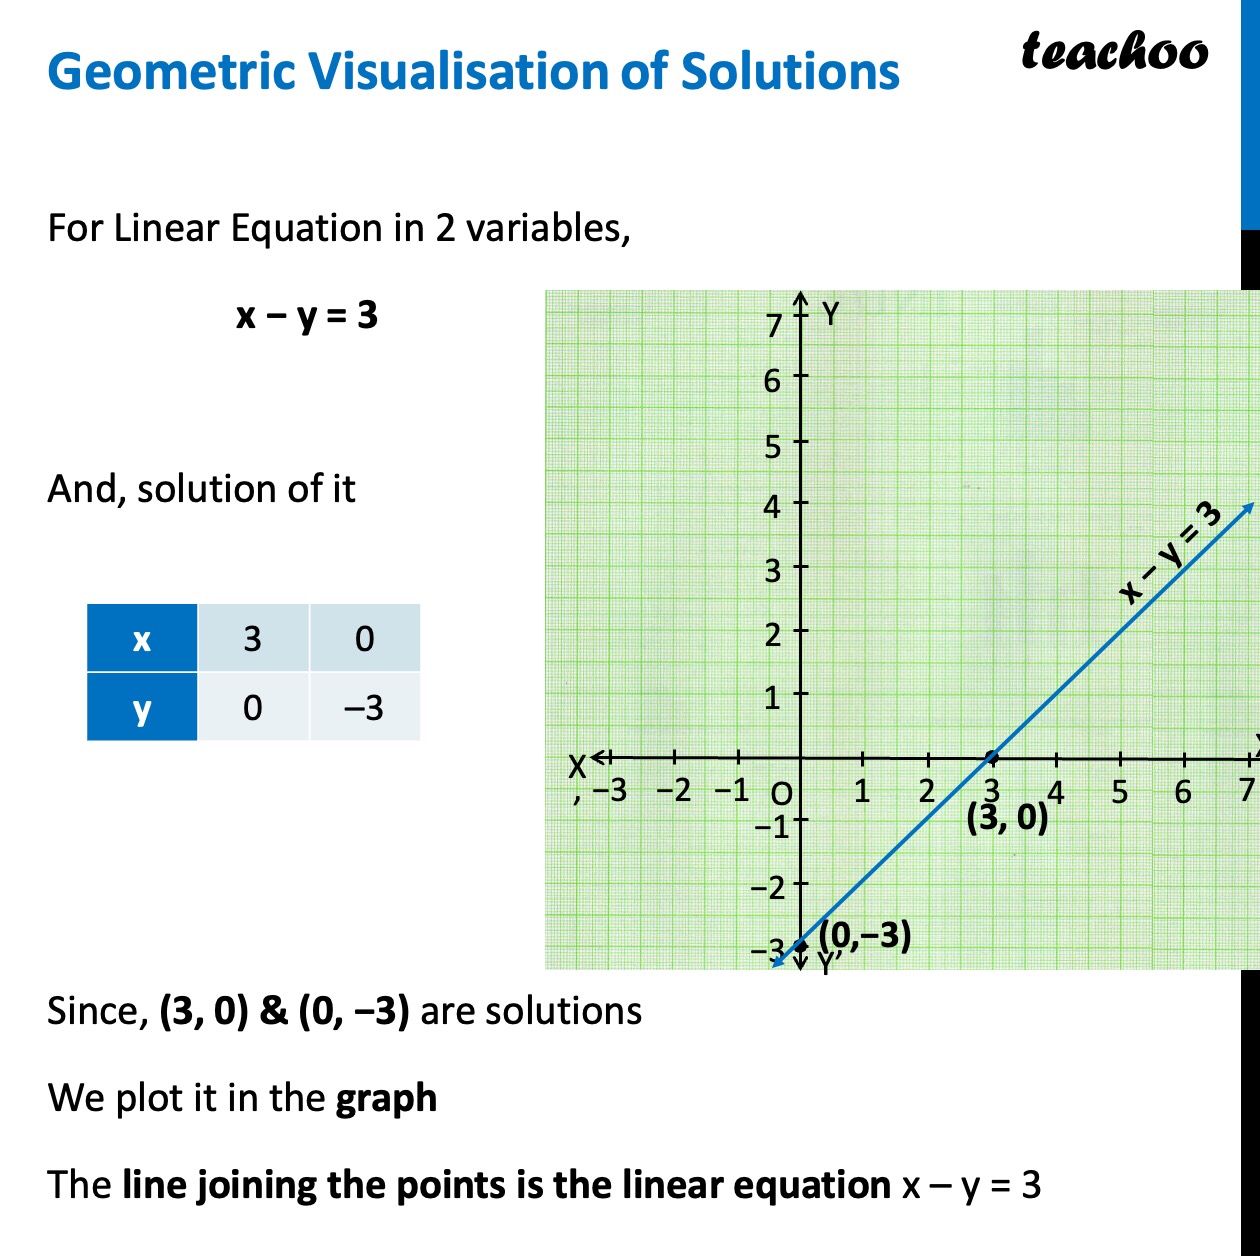
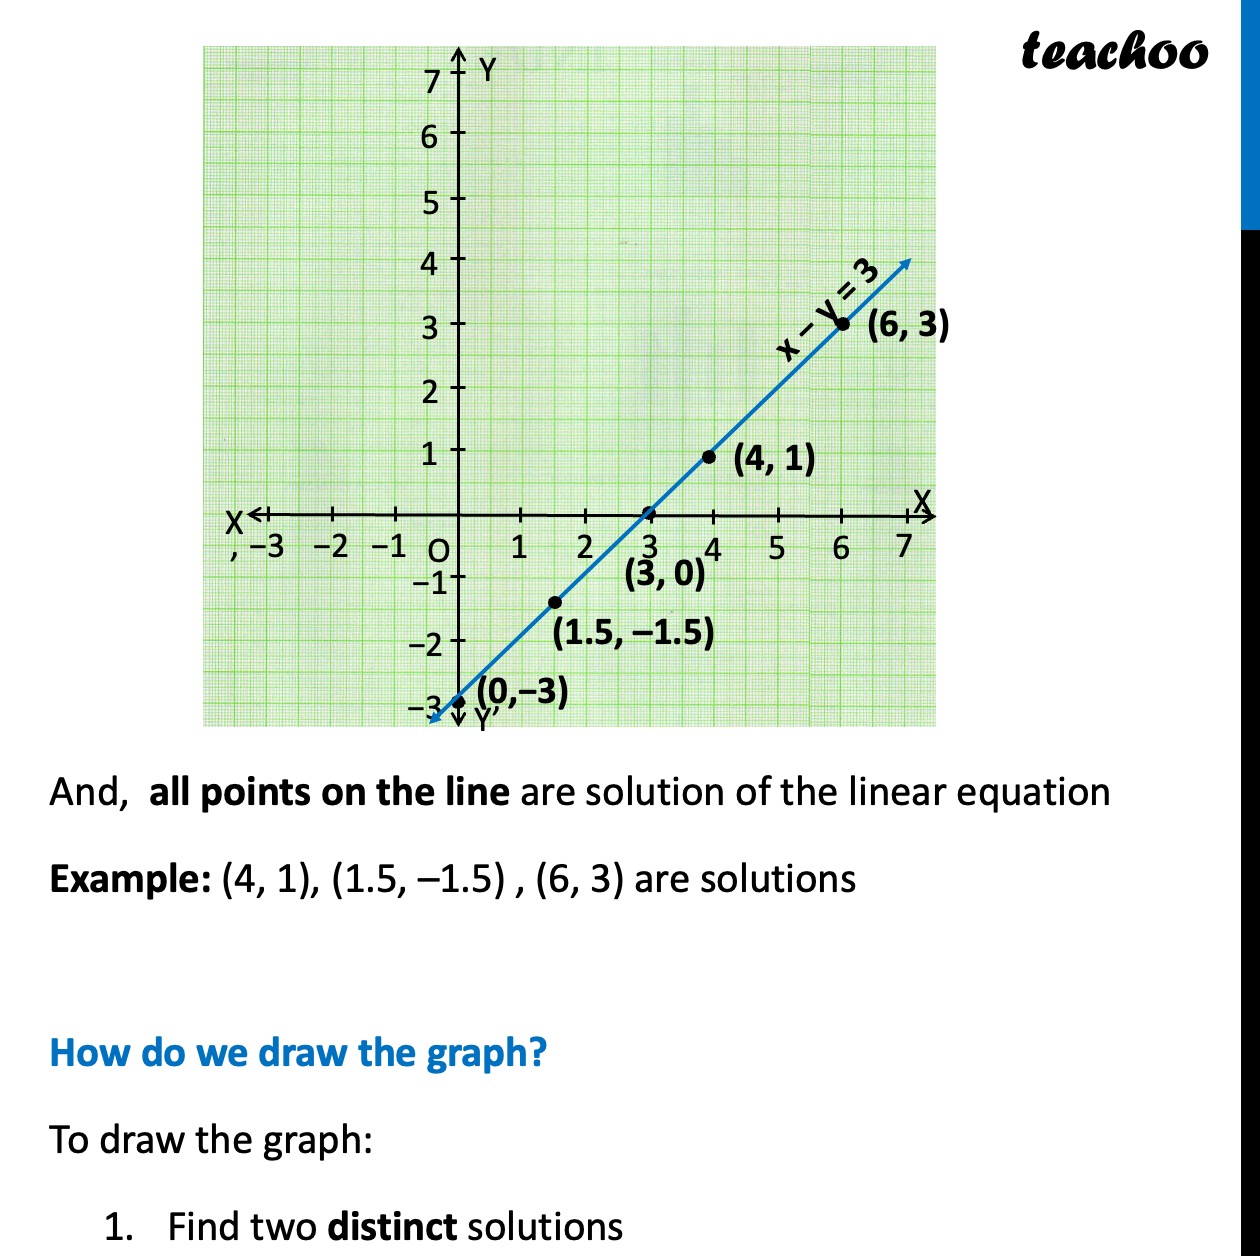
Geometric Visualisation of Solutions For Linear Equation in 2 variables, x − y = 3 And, solution of it Since, (3, 0) & (0, −3) are solutions We plot it in the graph The line joining the points is the linear equation x – y = 3 x | 3 | 0 y | 0 | –3 O 1 1 −1 −1 2 3 4 5 6 7 Y Y’ X’ X −2 −3 2 3 4 5 6 7 −2 −3 (3, 0) (0,−3) x − y = 3 To pesca cs py. +r + And, all points on the line are solution of the linear equation Example: (4, 1), (1.5, –1.5) , (6, 3) are solutions How do we draw the graph? To draw the graph: Find two distinct solutions Plot their points Draw a straight line through them and extend it in both directions Two distinct points determine the line. A third point provides a check on your calculations and plotting. O 1 1 −1 −1 2 3 4 5 6 7 Y Y’ X’ X −2 −3 2 3 4 5 6 7 −2 −3 (3, 0) (0,−3) x − y = 3 (4, 1) (1.5, –1.5) (6, 3) To pesca cs py. +r + Plot their points Draw a straight line through them and extend it in both directions Two distinct points determine the line. A third point provides a check on your calculations and plotting. Number of solutions of a linear equations Since all points on the line is a solution of the linear equation And there are infinite points on the line ∴ There are infinite number of solutions of linear equations Why choose x = 0 and y = 0 to find points? The choices x = 0 and y = 0 are convenient because they find where the line crosses the axes Setting x = 0 finds a point on the y-axis Setting y = 0 finds a point on the x-axis Setting x = 0 finds a point on the y-axis Setting y = 0 finds a point on the x-axis