
Figure it out - Page 122-123
Last updated at March 5, 2026 by Teachoo
Transcript
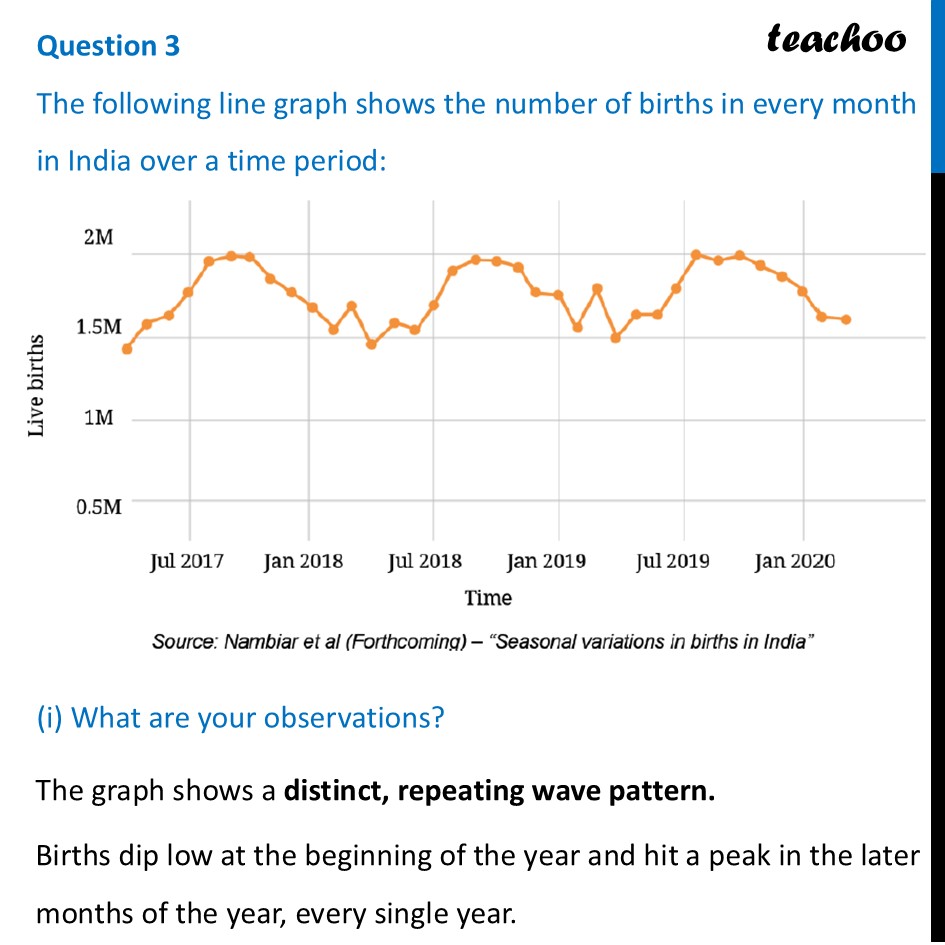
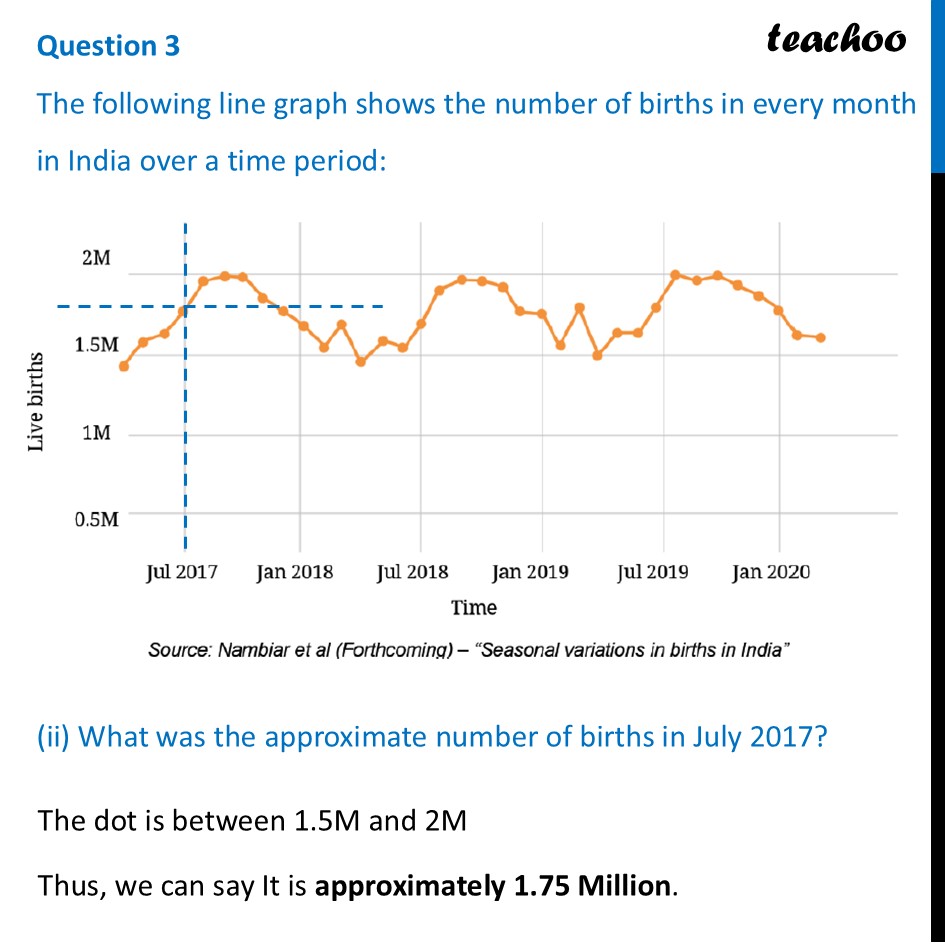
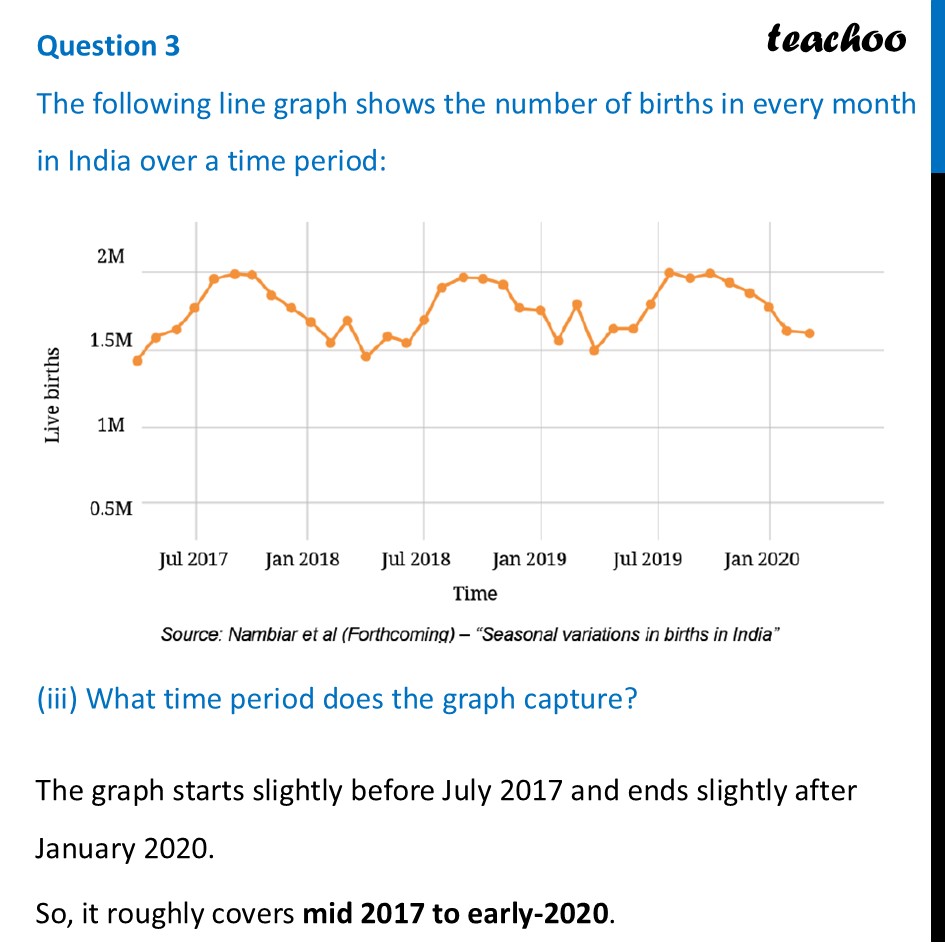
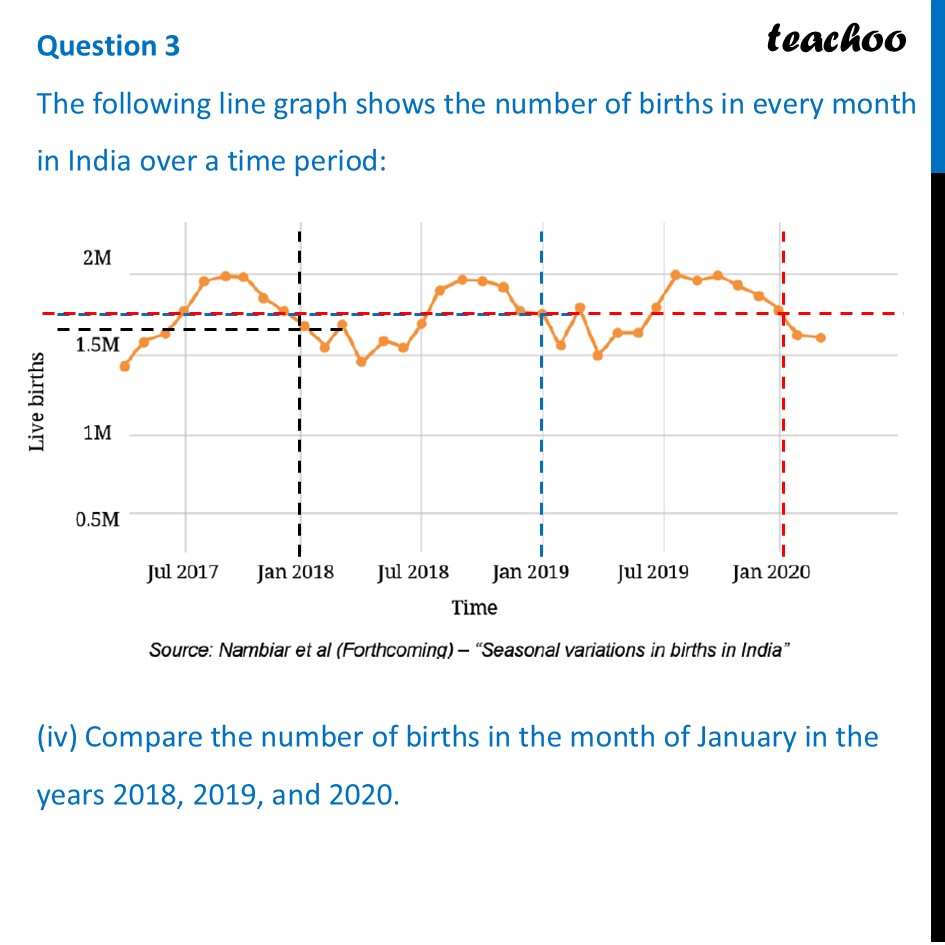
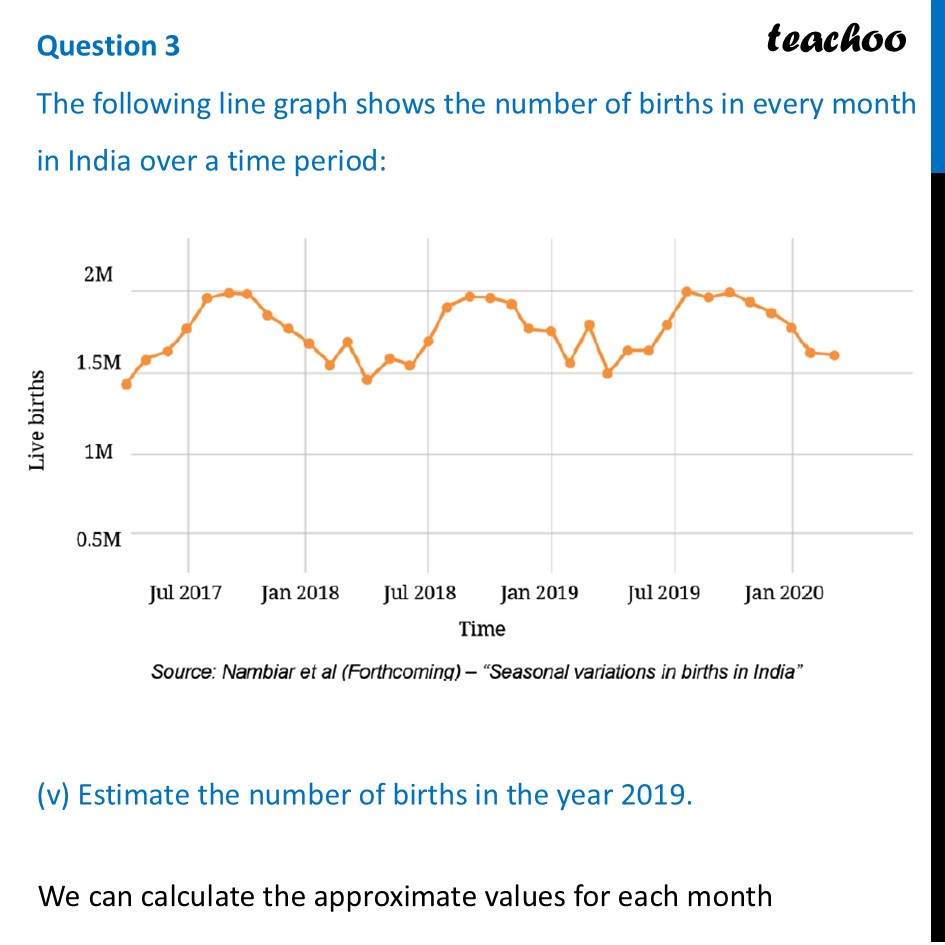
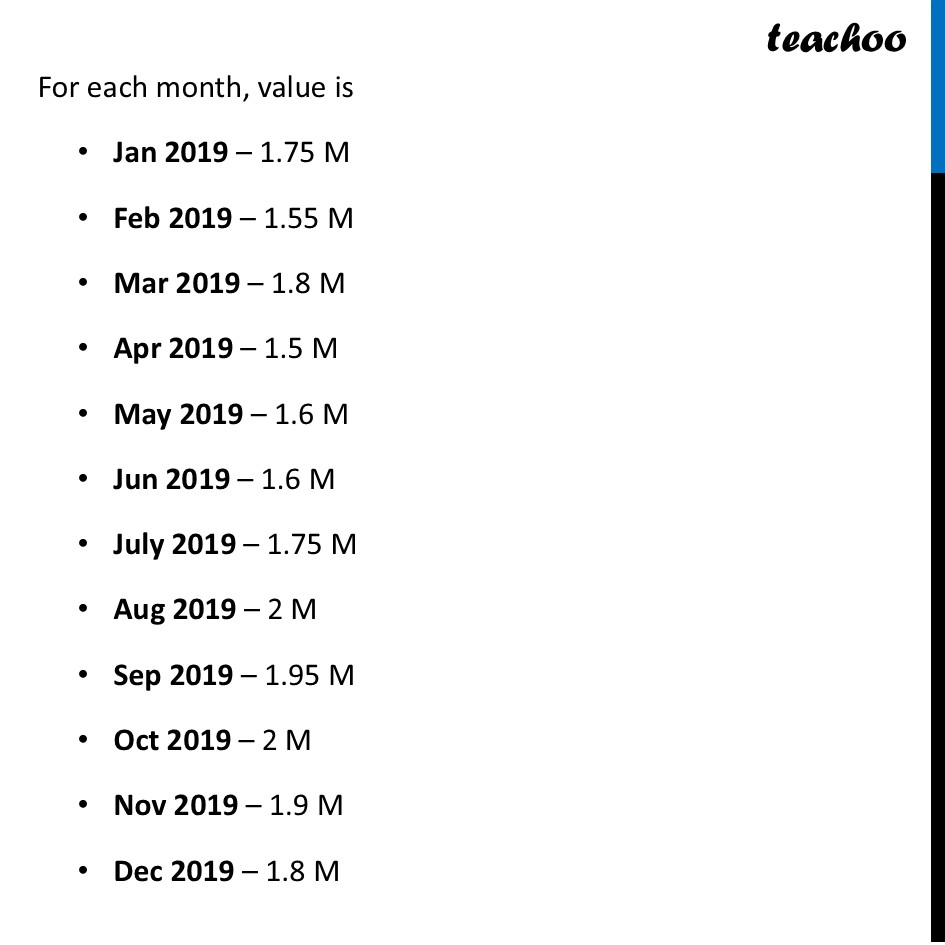
Question 3 The following line graph shows the number of births in every month in India over a time period: (i) What are your observations?The graph shows a distinct, repeating wave pattern. Births dip low at the beginning of the year and hit a peak in the later months of the year, every single year. Question 3 The following line graph shows the number of births in every month in India over a time period: (ii) What was the approximate number of births in July 2017?The dot is between 1.5M and 2M Thus, we can say It is approximately 1.75 Million. Question 3 The following line graph shows the number of births in every month in India over a time period: (iii) What time period does the graph capture?The graph starts slightly before July 2017 and ends slightly after January 2020. So, it roughly covers mid 2017 to early-2020. Question 3 The following line graph shows the number of births in every month in India over a time period: (iv) Compare the number of births in the month of January in the years 2018, 2019, and 2020.We notice that Dot of Jan 2019 is higher than Dot of Jan 2018 Dot of Jan 2020 is same as than Dot of Jan 2019 Question 3 The following line graph shows the number of births in every month in India over a time period: (v) Estimate the number of births in the year 2019.We can calculate the approximate values for each month For each month, value is Jan 2019 – 1.75 M Feb 2019 – 1.55 M Mar 2019 – 1.8 M Apr 2019 – 1.5 M May 2019 – 1.6 M Jun 2019 – 1.6 M July 2019 – 1.75 M Aug 2019 – 2 M Sep 2019 – 1.95 M Oct 2019 – 2 M Nov 2019 – 1.9 M Dec 2019 – 1.8 M Thus, Number of births in 2019 = 1.75 + 1.55 + 1.8 + 1.5 + 1.6 + 1.6 + 1.75 + 2 + 1.95 + 2 + 1.9 + 1.8 = 21.2 M
