Figure it out - Page 122-123
Last updated at March 5, 2026 by Teachoo
Transcript
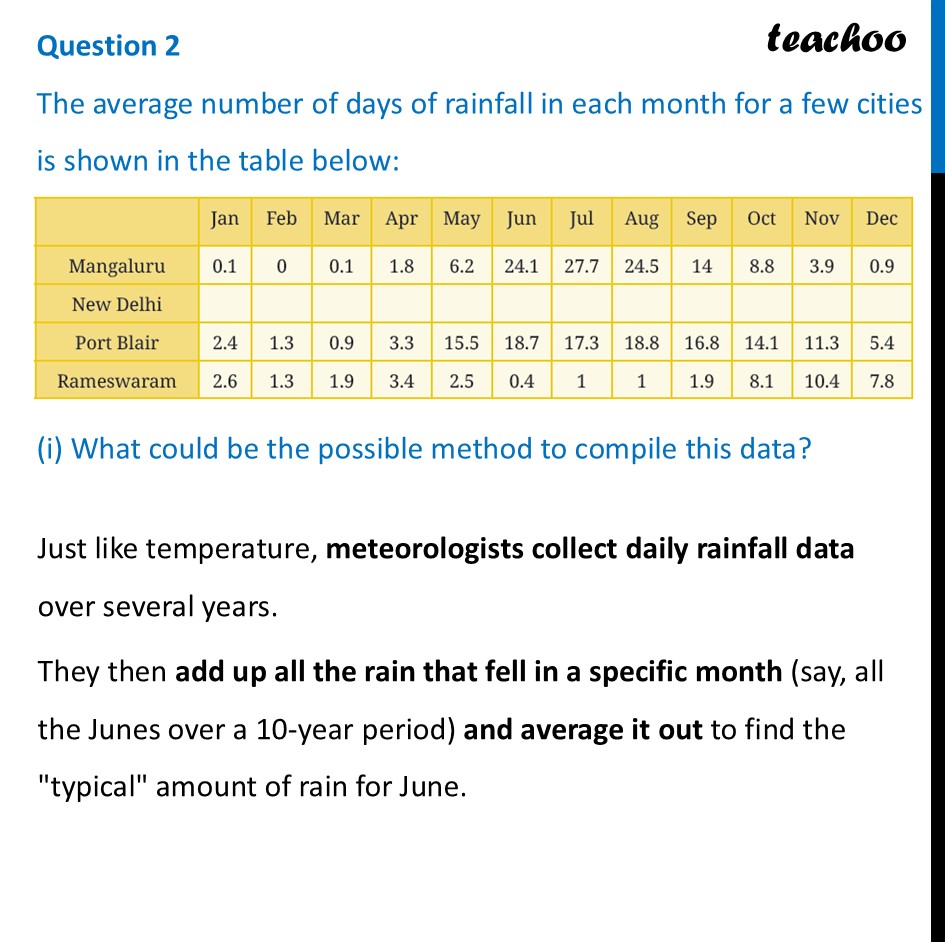
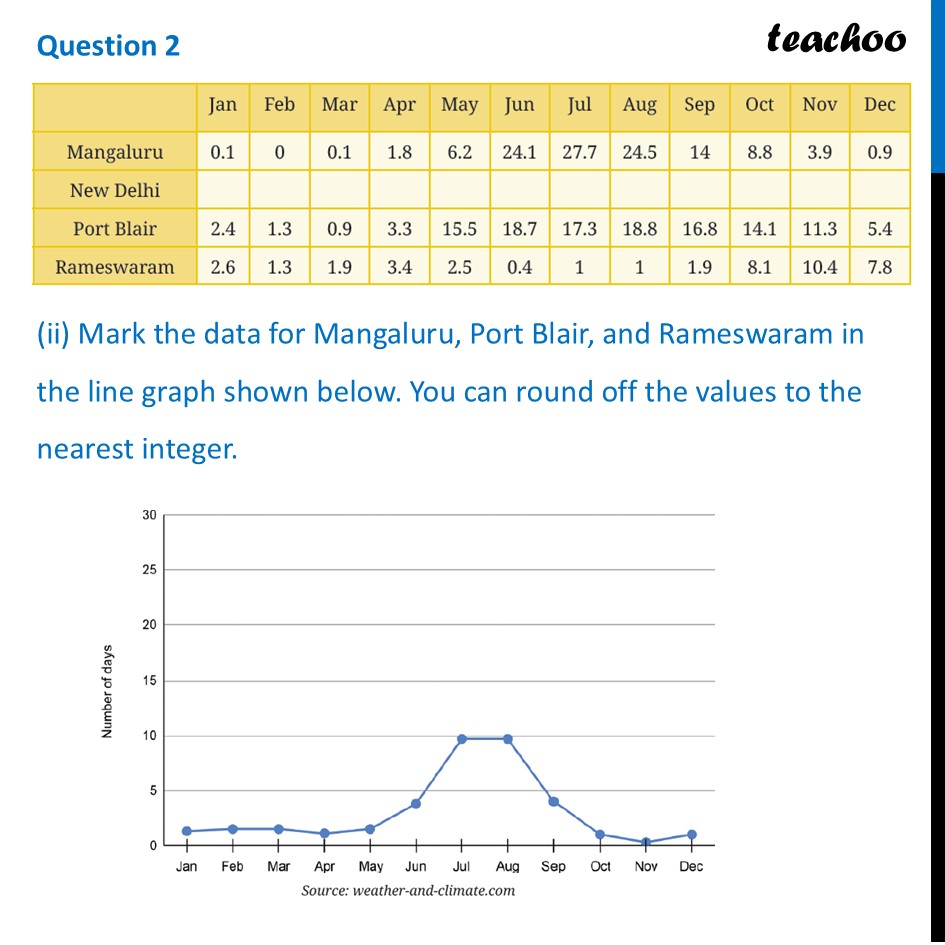
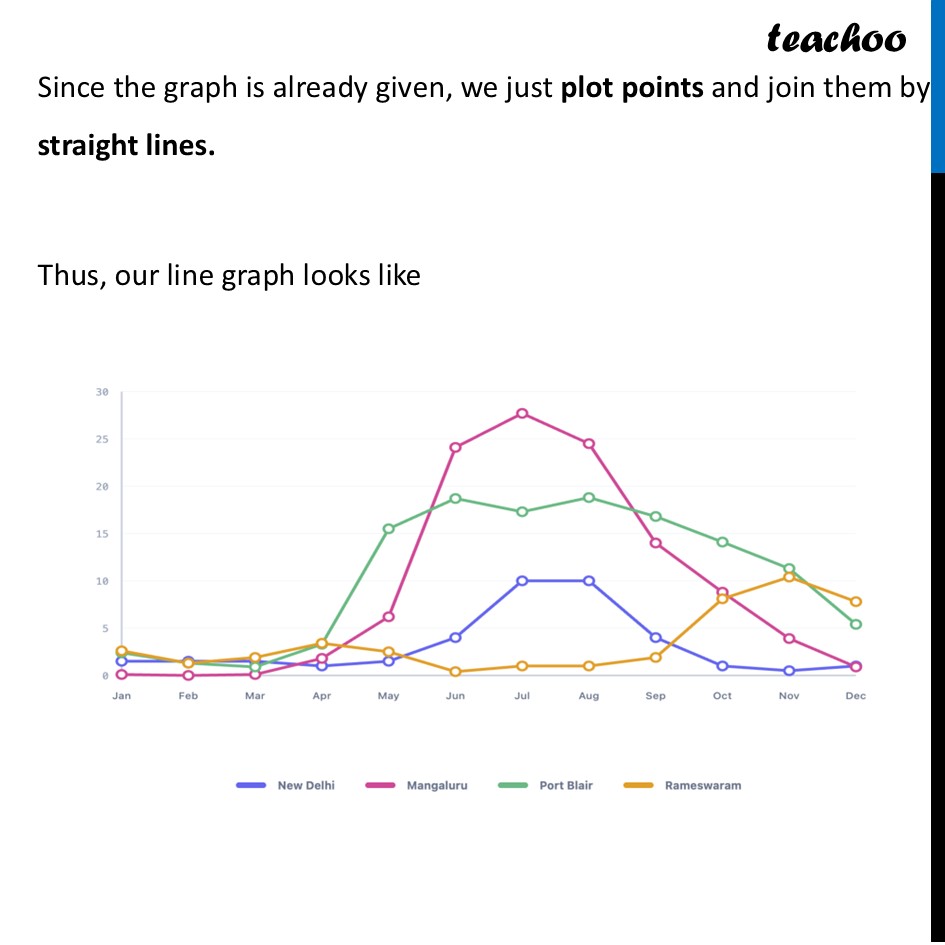
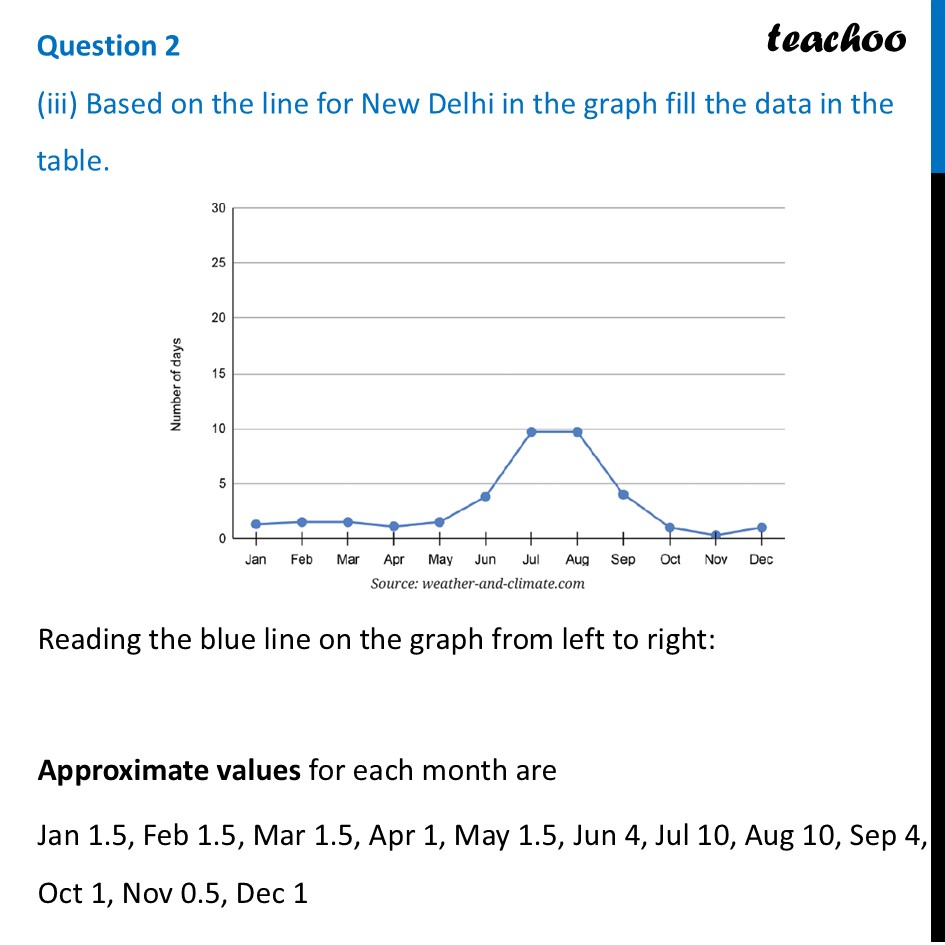
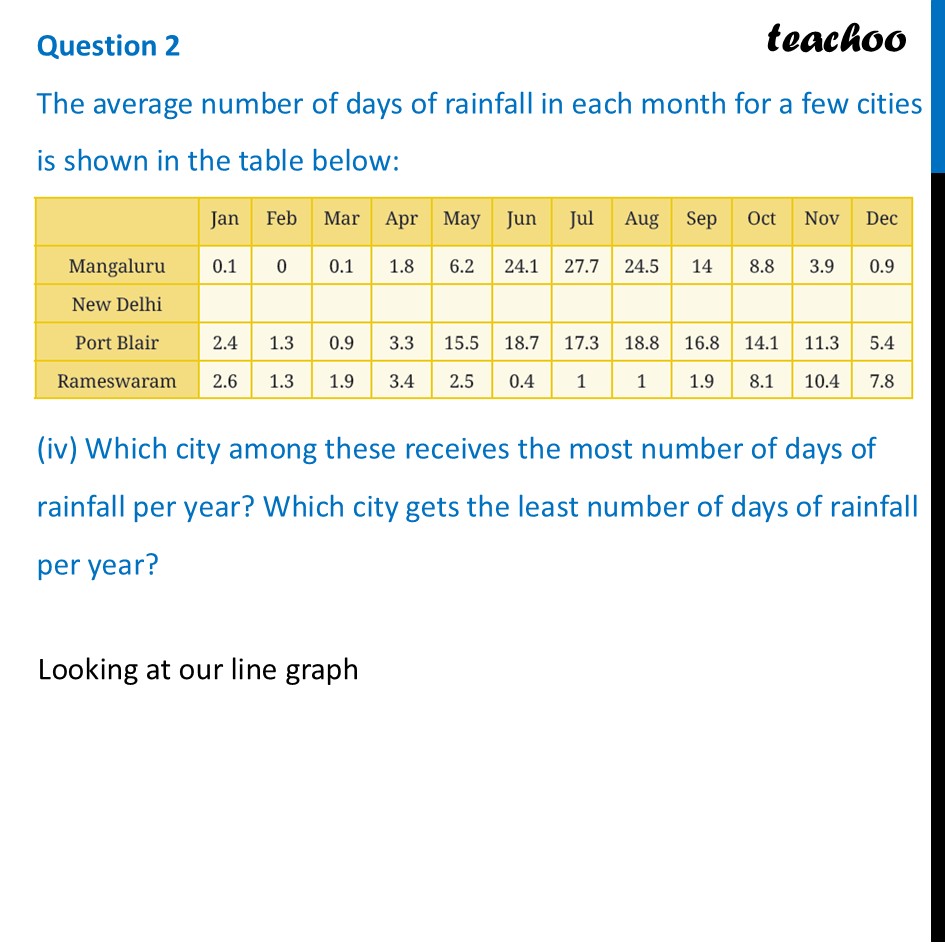
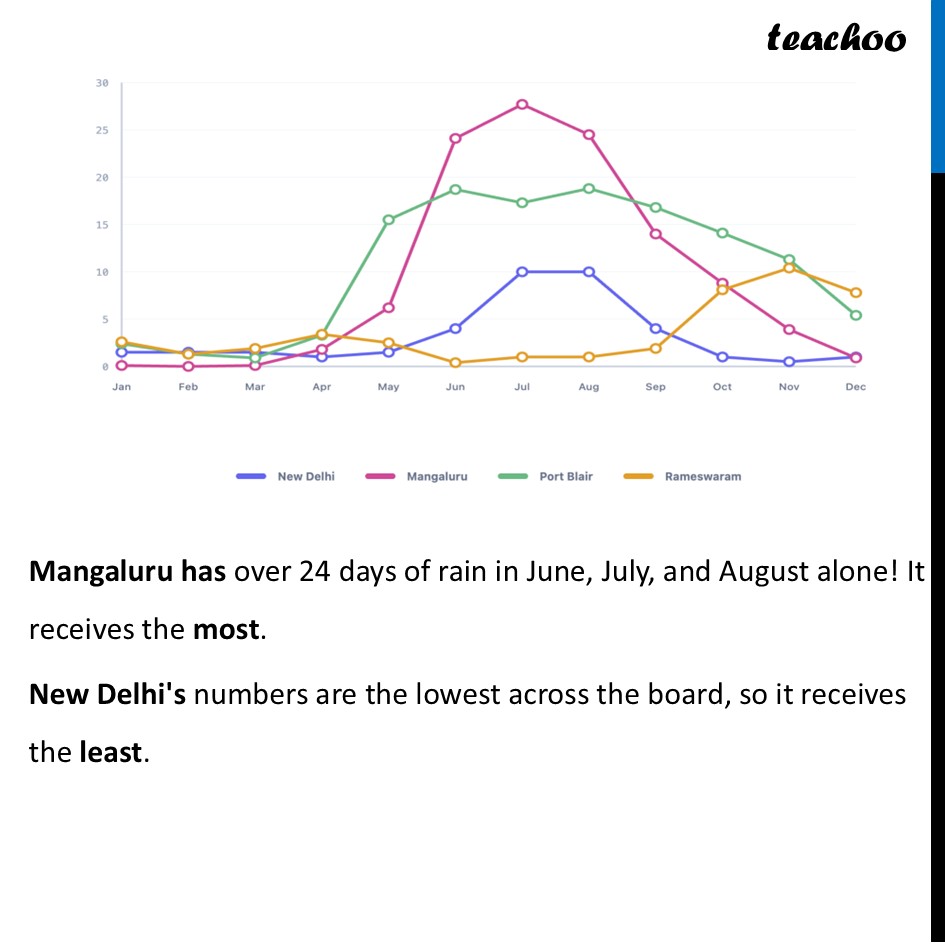
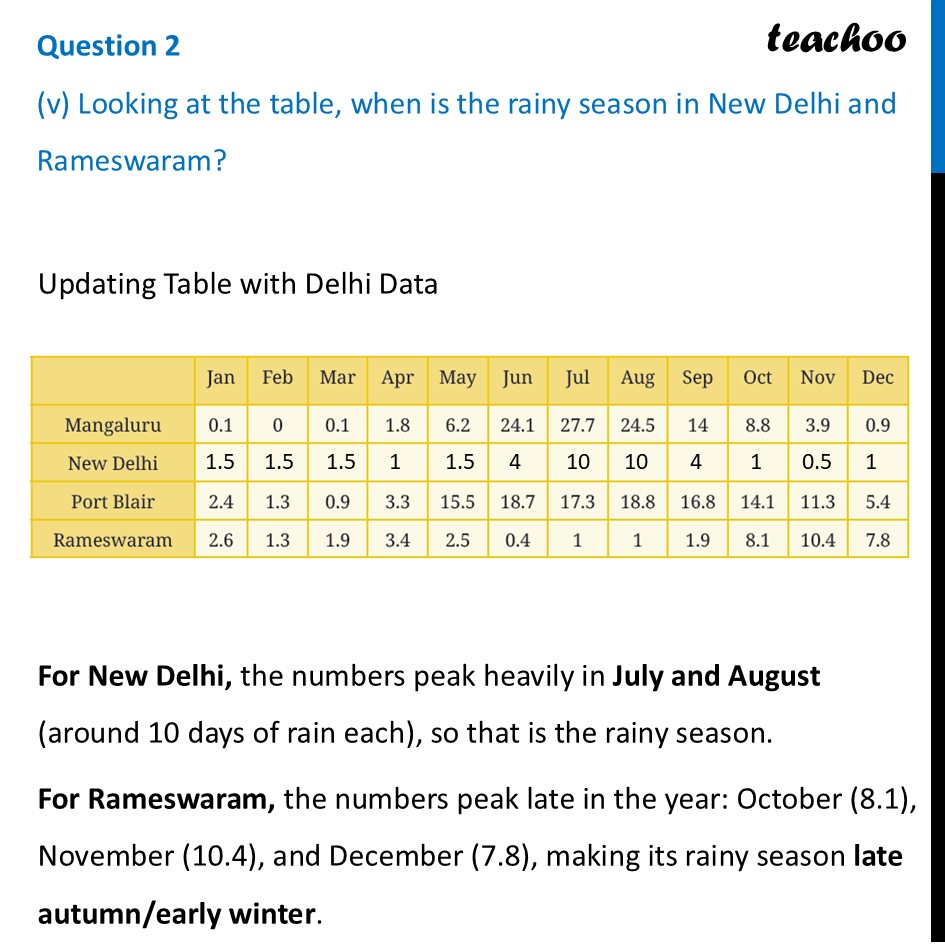
Question 2 The average number of days of rainfall in each month for a few cities is shown in the table below: (i) What could be the possible method to compile this data?Just like temperature, meteorologists collect daily rainfall data over several years. They then add up all the rain that fell in a specific month (say, all the Junes over a 10-year period) and average it out to find the "typical" amount of rain for June. Question 2 (ii) Mark the data for Mangaluru, Port Blair, and Rameswaram in the line graph shown below. You can round off the values to the nearest integer.Since the graph is already given, we just plot points and join them by straight lines. Thus, our line graph looks like Question 2 (iii) Based on the line for New Delhi in the graph fill the data in the table.Reading the blue line on the graph from left to right: Approximate values for each month are Jan 1.5, Feb 1.5, Mar 1.5, Apr 1, May 1.5, Jun 4, Jul 10, Aug 10, Sep 4, Oct 1, Nov 0.5, Dec 1 Question 2 The average number of days of rainfall in each month for a few cities is shown in the table below: (iv) Which city among these receives the most number of days of rainfall per year? Which city gets the least number of days of rainfall per year?Looking at our line graph Mangaluru has over 24 days of rain in June, July, and August alone! It receives the most. New Delhi's numbers are the lowest across the board, so it receives the least. Question 2 (v) Looking at the table, when is the rainy season in New Delhi and Rameswaram?Updating Table with Delhi Data For New Delhi, the numbers peak heavily in July and August (around 10 days of rain each), so that is the rainy season. For Rameswaram, the numbers peak late in the year: October (8.1), November (10.4), and December (7.8), making its rainy season late autumn/early winter.
