![[Class 8 Maths] Which of the following statements are valid inferences - Line Graphs](https://cdn.teachoo.com/e91cc097-1dc0-46fb-b224-f583648cc3eb/slide16.jpg)
Last updated at March 5, 2026 by Teachoo
Transcript
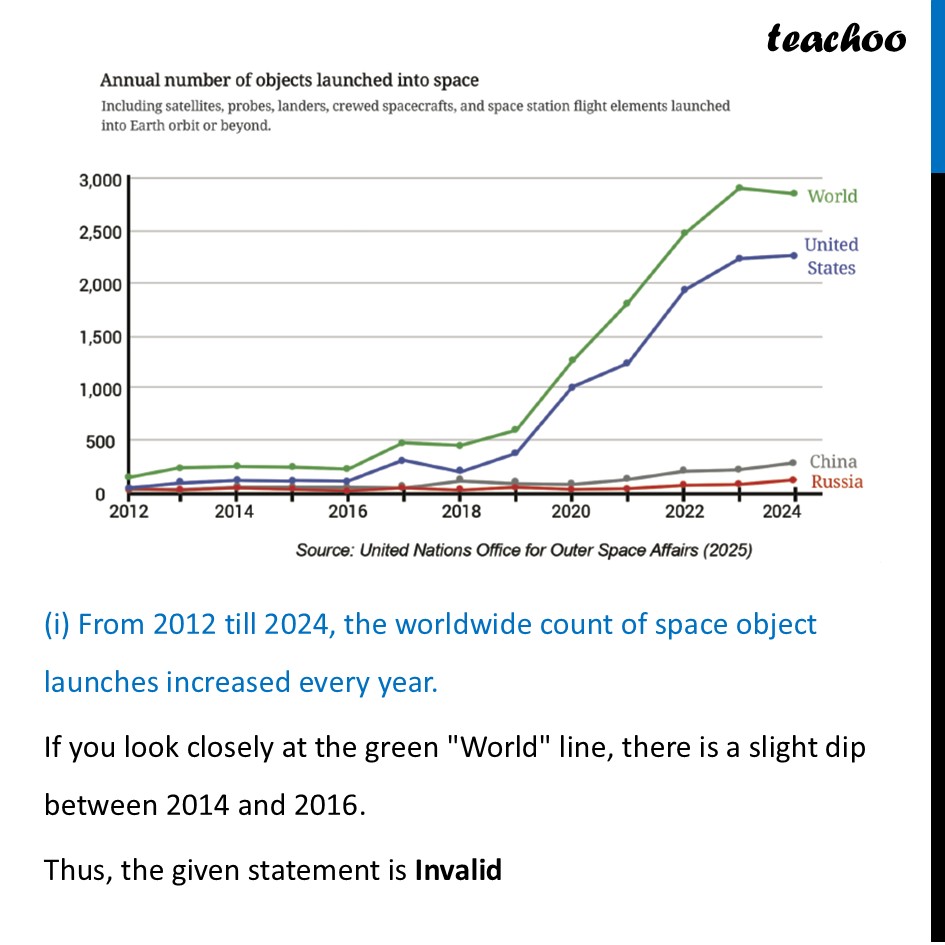
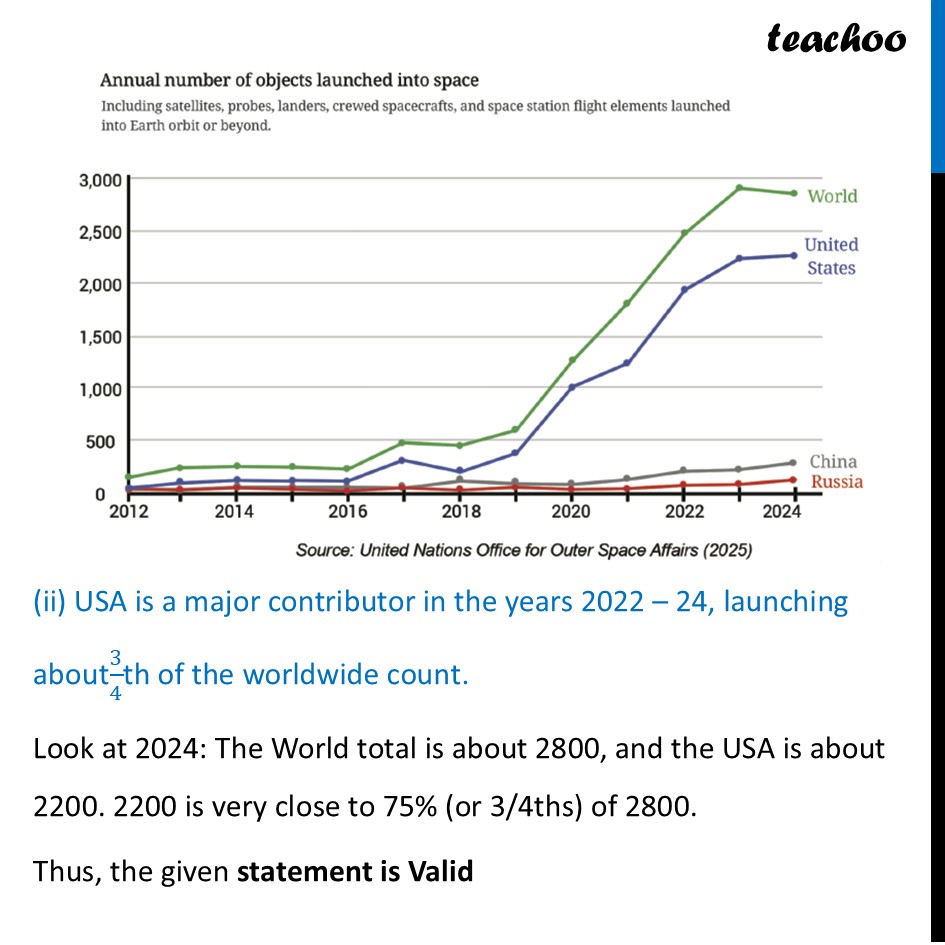
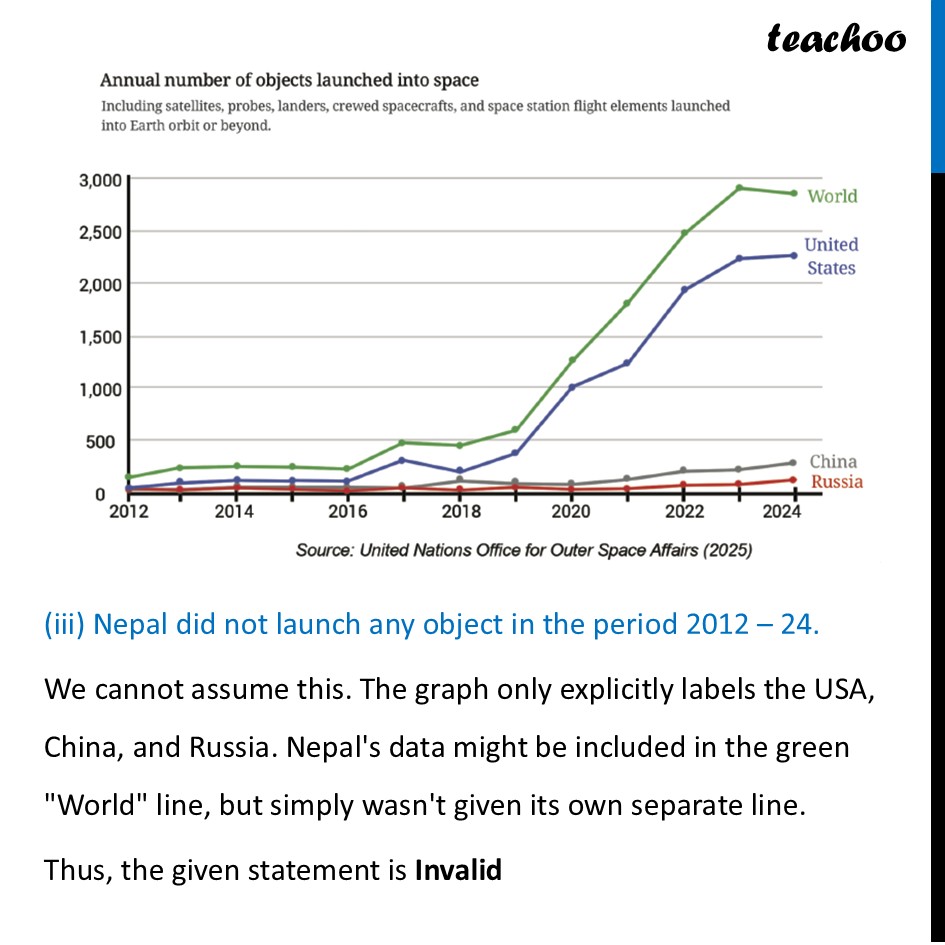
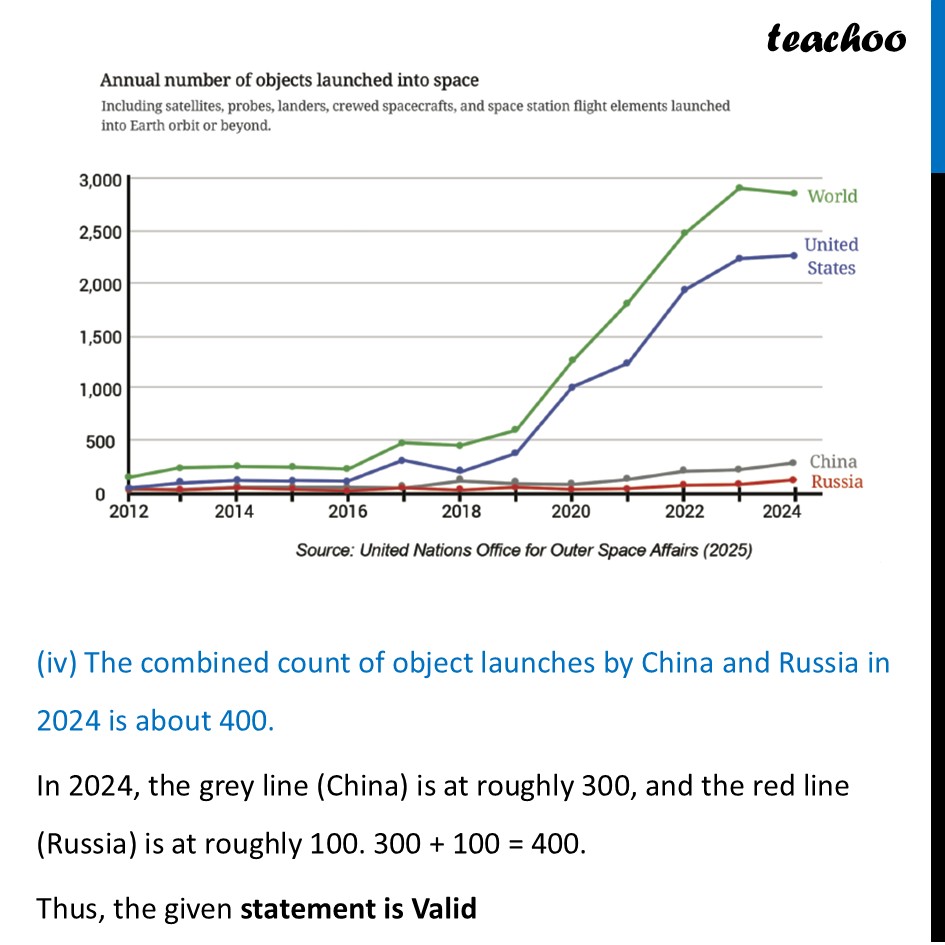
The counts of the three countries don’t add up to the worldwide count. Therefore, we can infer that the counts of other countries are not shown in this visualisation. Conclusion: Space launches have dramatically increased in the last 5 years, almost entirely driven by activity from the United States. Let’s look at our graphs and answer each inference one by one (i) From 2012 till 2024, the worldwide count of space object launches increased every year. If you look closely at the green "World" line, there is a slight dip between 2014 and 2016. Thus, the given statement is Invalid (ii) USA is a major contributor in the years 2022 – 24, launching about3/4th of the worldwide count. Look at 2024: The World total is about 2800, and the USA is about 2200. 2200 is very close to 75% (or 3/4ths) of 2800. Thus, the given statement is Valid (iii) Nepal did not launch any object in the period 2012 – 24. We cannot assume this. The graph only explicitly labels the USA, China, and Russia. Nepal's data might be included in the green "World" line, but simply wasn't given its own separate line. Thus, the given statement is Invalid (iv) The combined count of object launches by China and Russia in 2024 is about 400. In 2024, the grey line (China) is at roughly 300, and the red line (Russia) is at roughly 100. 300 + 100 = 400. Thus, the given statement is Valid
